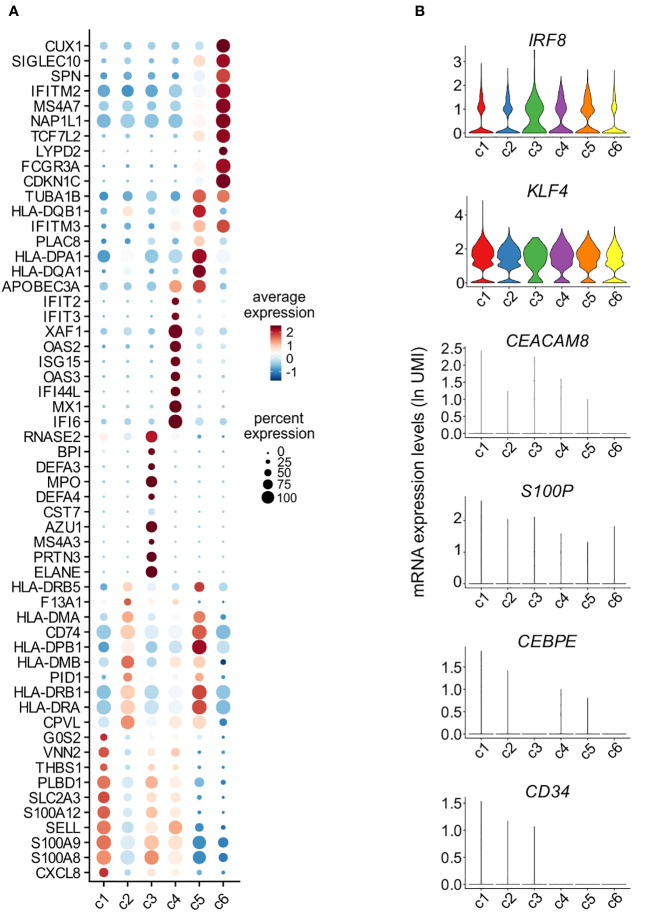
Figure 5.
Characterization of monocyte clusters identified by scRNA-seq analysis. (A) Dot plot showing the top 10 genes, sorted by average log fold change, specific for the monocyte clusters (c1-c6) as identified and shown in Figure 4C . Dot size represents the percentage of cells in each cluster with more than one read of the corresponding gene. The color intensity of the dots represents the level of expression of the genes. (B) Violin plots showing the mRNA expression levels (as ln(UMI)) of selected genes (i.e., IRF8, KLF4, CEACAM8, S100P, CEBPE and CD34) across c1-c6 cells.

