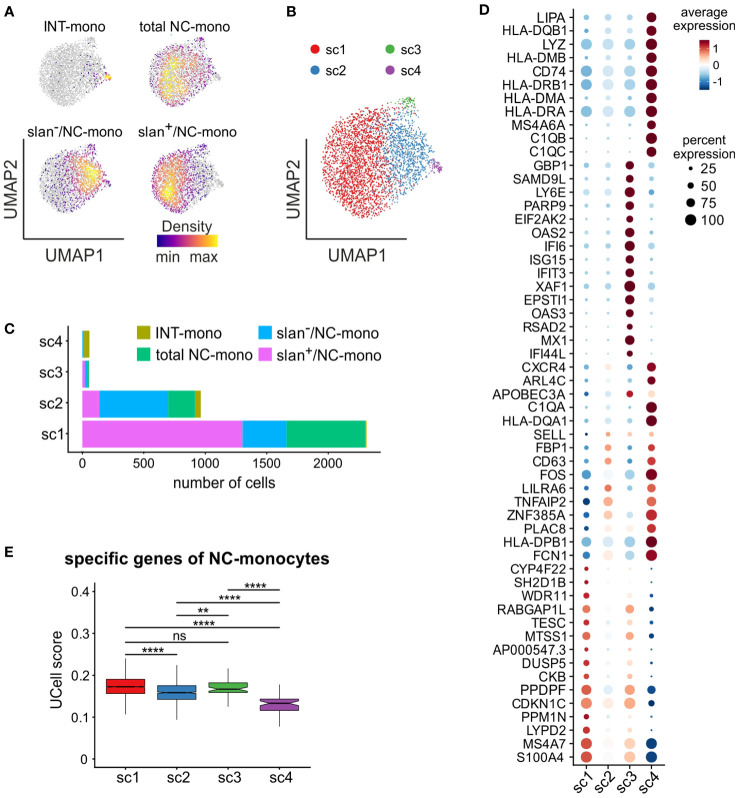
Figure 6.
In-depth analysis of the non-classical monocyte cluster 6. scRNA-seq profiles of cells from c6 of Figure 4C were retrieved and subjected to further analysis. (A) Density plots of INT-, total/NC-, slan−/NC- and slan+/NC-monocytes overlaid on the UMAP plot of c6. Density of cells in each plot is depicted according to the indications of the colored bar. (B) UMAP plot showing scRNA-seq profiles of c6 non-classical monocytes grouped in 4 sub-clusters (sc1-sc4), identified by clustering analysis. (C) Stacked bar graph showing the number of INT-, total/NC-, slan+/NC- and slan−/NC- in sc1-sc4. (D) Dot plot showing the top 15 marker genes, sorted by average log fold change, associated with the non-classical monocyte sub-clusters identified in panel (B) Colors of the dots indicate the average expression of each gene in each sub-cluster scaled across all clusters. Dot size represents the percentage of cells in each sub-cluster with more than one read of the corresponding gene. (E) Box plot showing the UCell score of non-classical specific genes retrieved from reference (22) in sc1-sc4. The box plot shows the median with the lower and upper quartiles representing a 25th to 75th percentile range and whiskers extending to 1.5 × interquartile range (IQR). ns, not significant, **P < 0.01, ****P < 0.0001 by unpaired two-samples Wilcoxon test using the Bonferroni method correction for multiple comparisons.

