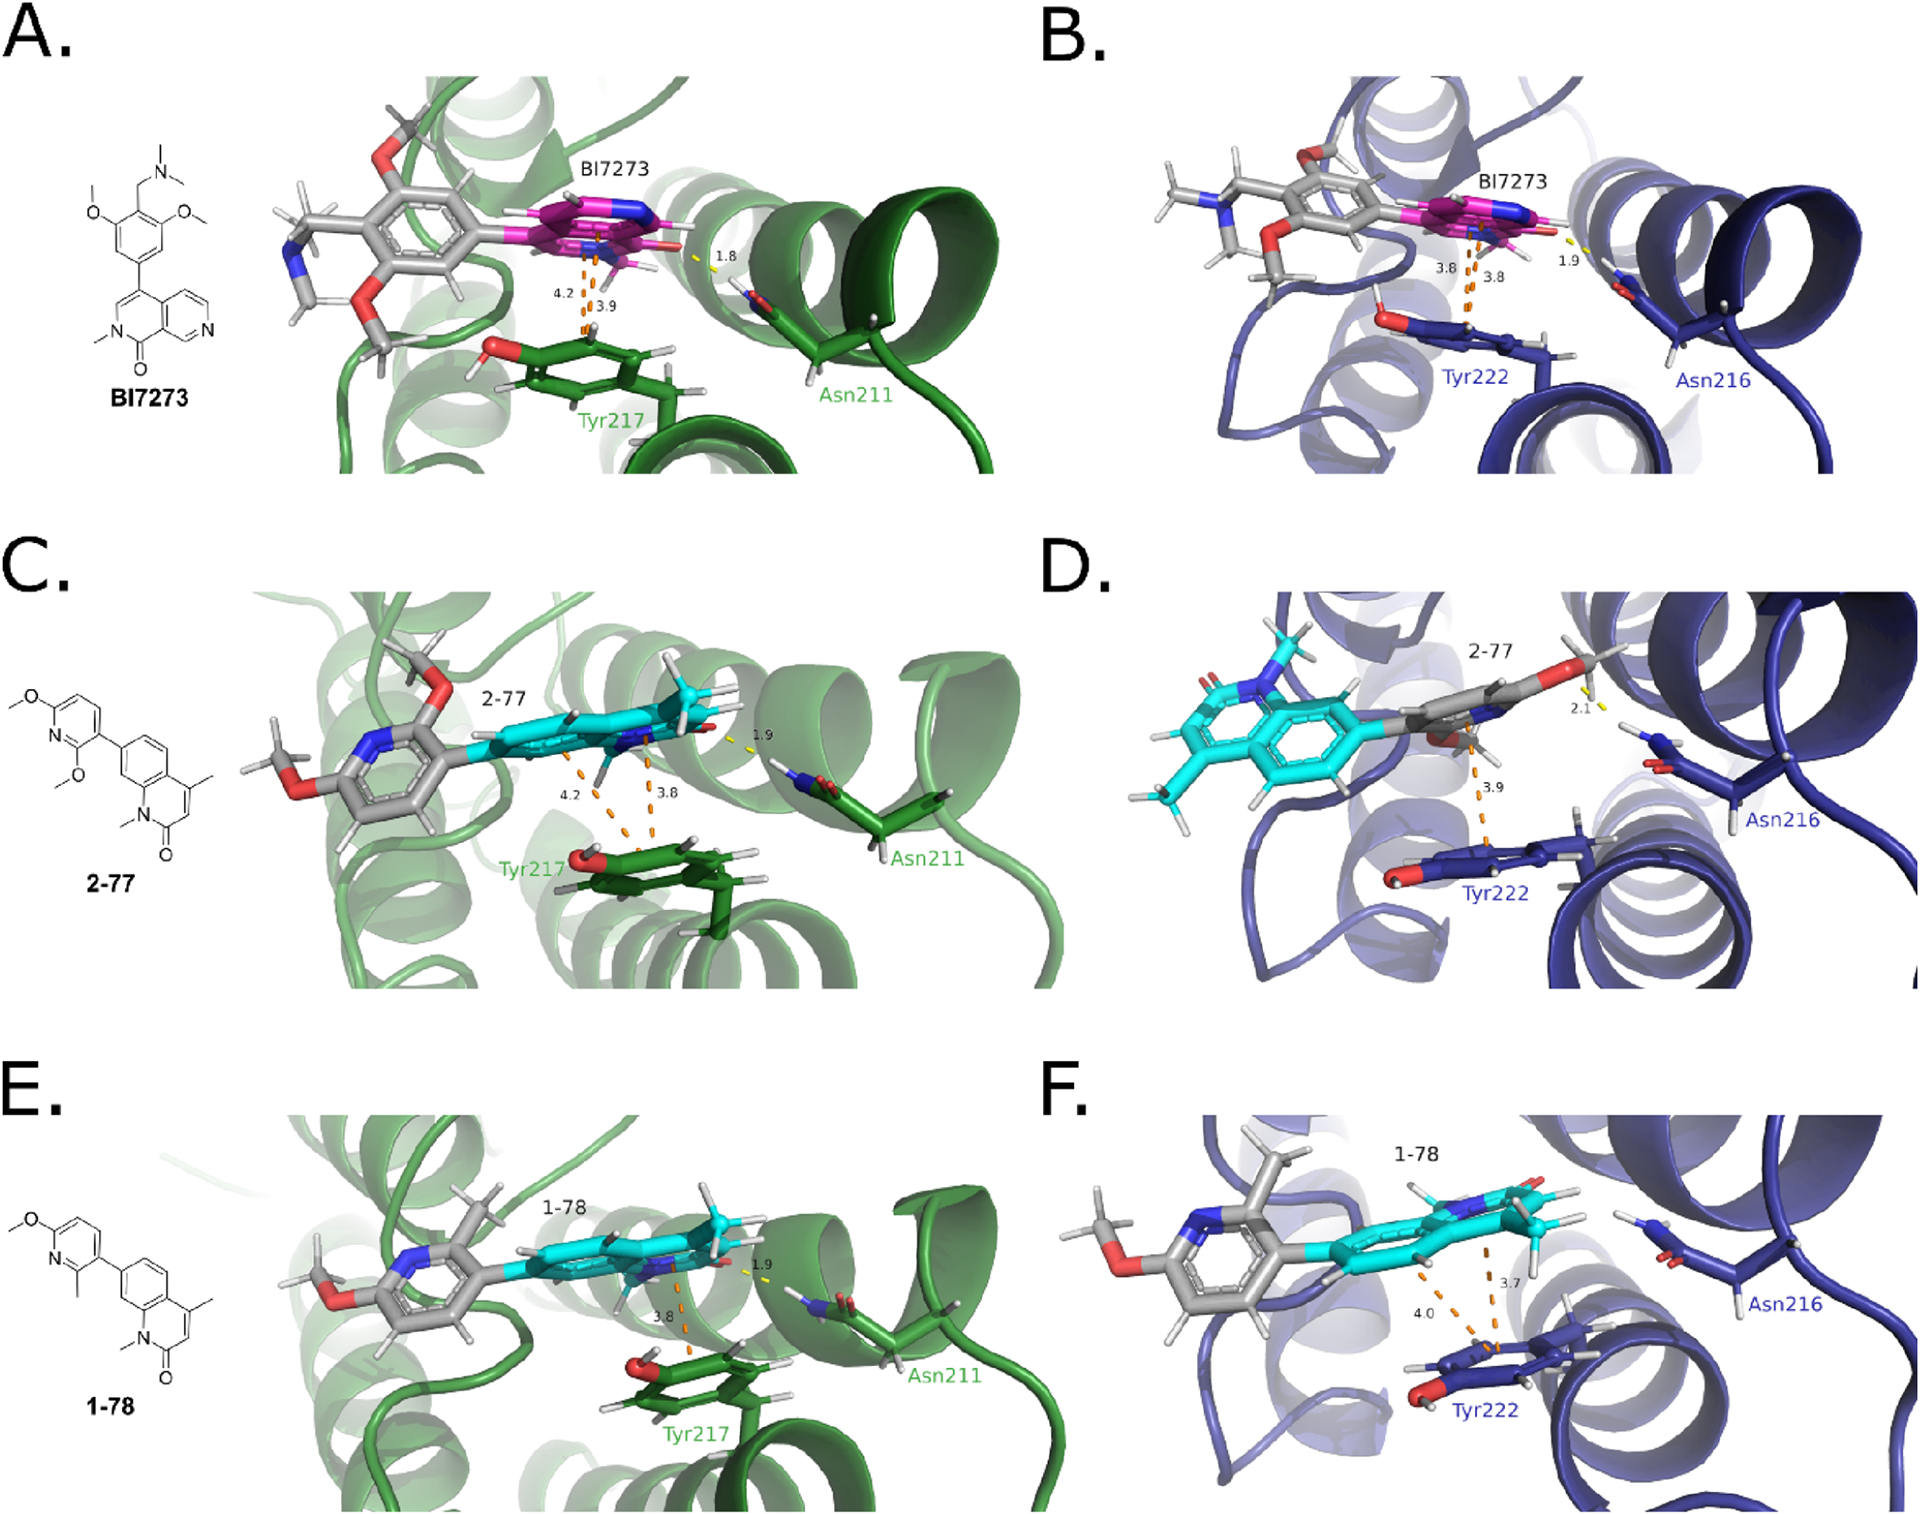
Figure 5.

Binding mode analysis of compounds docked against BRD7 BD (PDB: 6V1E) and BRD9 BD (PDB: 5EU1) performed in the Schrödinger Maestro suite. BI7273 was docked into (A) BRD7 BD (green) and (B) BRD9 BD (blue). 2–77 was docked into (C) BRD7 BD (green) and (D) BRD9 BD (blue). 1–78 was docked into (E) BRD7 BD (green) and (F) BRD9 BD (blue). Shown in sticks: the conserved Asn involved in the hydrogen bond and the Tyr involved in the π−π interactions. In magenta in panels (A) and (B): the core of BI7273. In cyan in panels (C)−(F): the core of 2–77 and 1–78. π−π interactions are depicted in orange dotted lines. Hydrogen bonds are depicted in yellow dotted lines. Distance of the interactions given in Å. Figures created in PyMOL.
