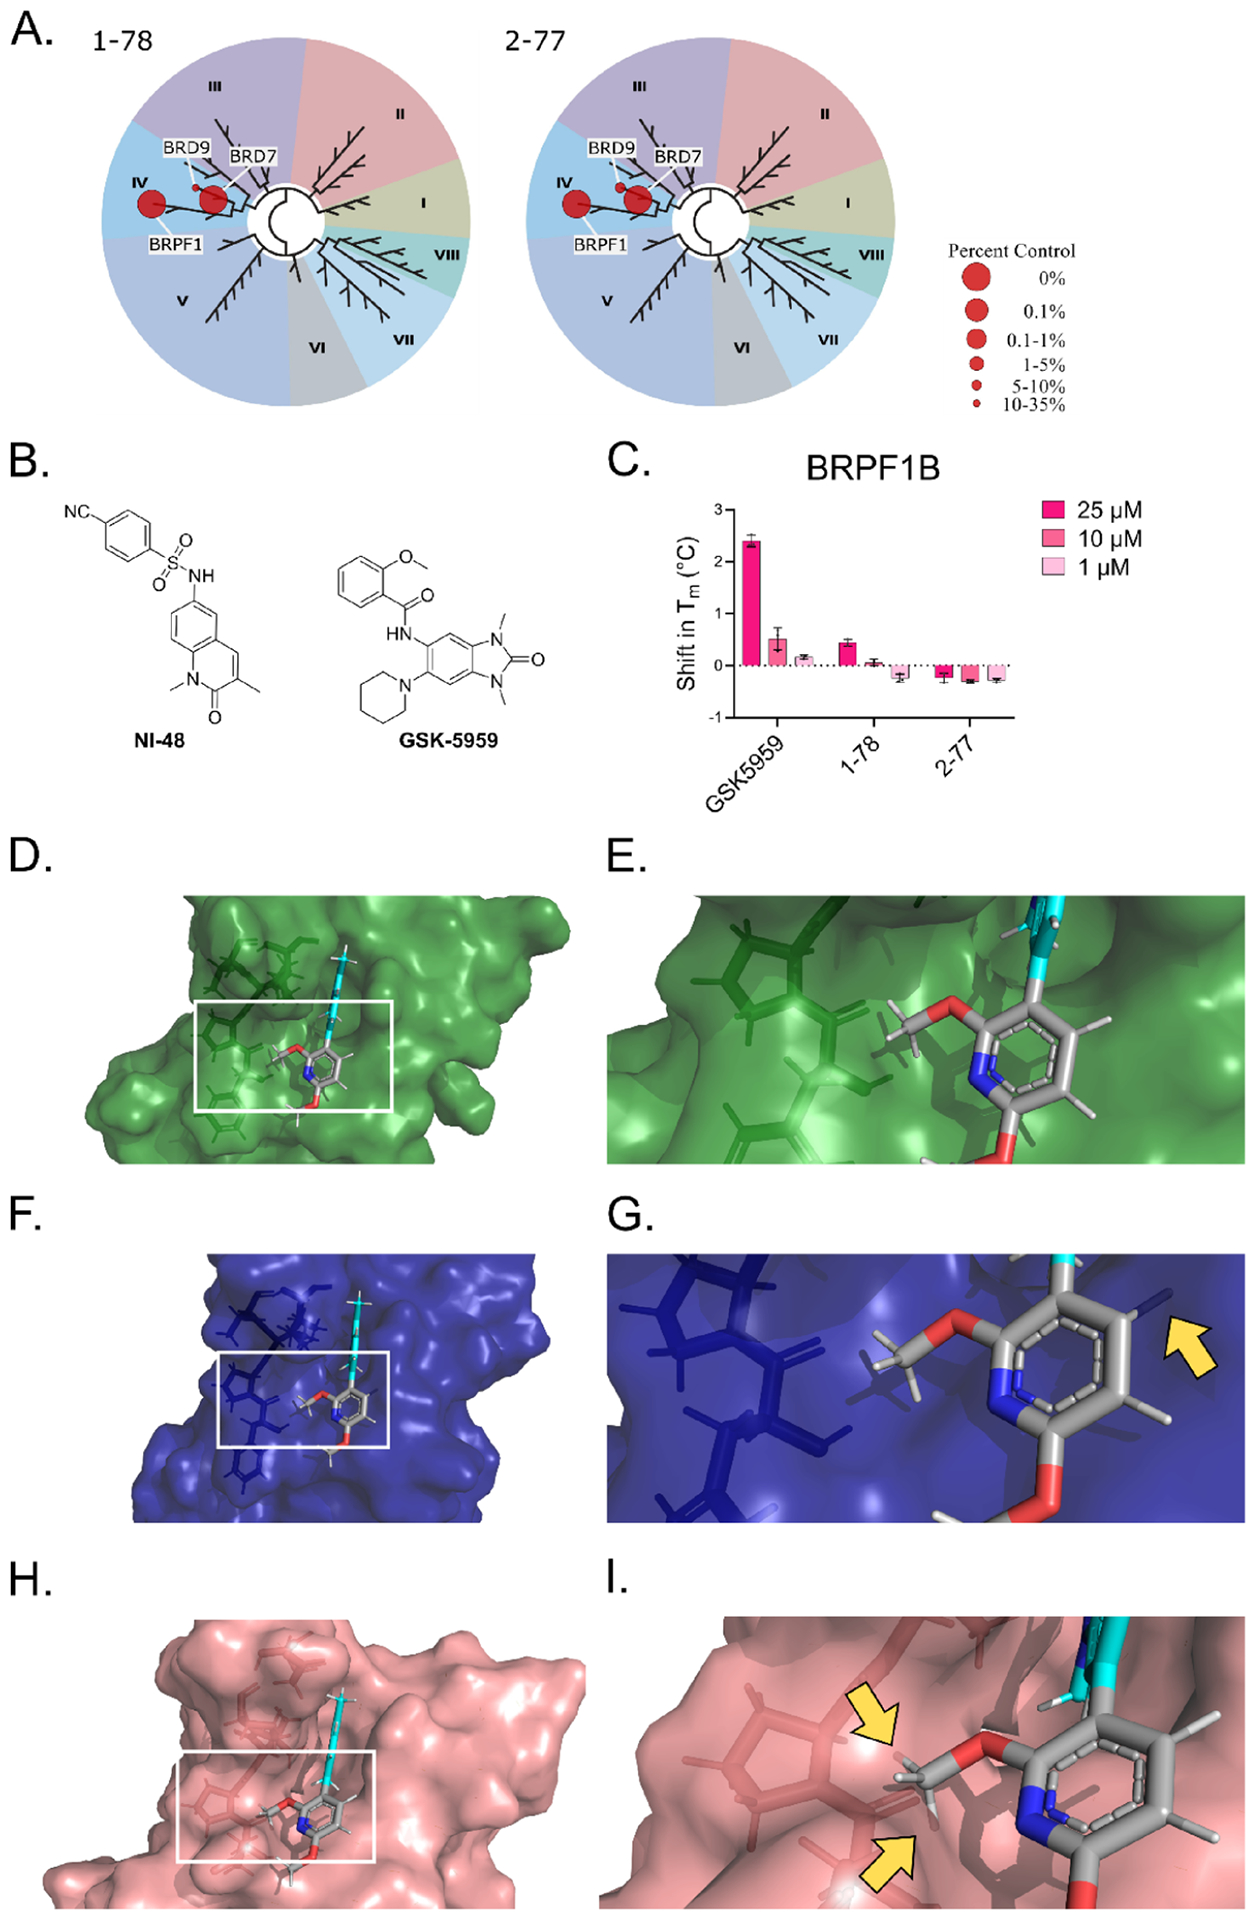
Figure 6.

(A) TREEspot interaction maps for 1–78 and 2–77 screened in the BROMOscan platform. The results for binding interactions for the compounds are reported as % of control (DMSO). (B) Structures of the BRPF1B inhibitors NI-48 and GSK-5959. (C) Results from the TSA using HIS-tagged BRPF1B and compounds at 25, 10, or 1 μM. The Tm of the proteins in the different conditions was calculated based on differential scanning fluorimetry readings at increasing temperatures from four replicates using nonlinear least squares fit on GraphPad Prism 9. The shift in Tm was calculated with respect to the vehicle. (D) 2–77 docked against BRD7, showing the surface of the protein and depicting the amino acids involved in the hydrophobic region right outside the binding pocket as sticks. (E) Zoomed-in region indicated in panel (D). (F) The binding pose of 2–77 docked against BRD7 aligned to the binding pocket of BRD9, showing the surface of BRD9 and depicting the amino acids involved in the hydrophobic region right outside the binding pocket as sticks. (G) Zoomed-in region indicated in panel (F). (H) The binding pose of 2–77 docked against BRD7 aligned to the binding pocket of BRPF1B, showing the surface of BRPF1B and depicting the amino acids involved in the hydrophobic region right outside the binding pocket as sticks. (I) Zoomed-in region indicated in panel (H). Yellow arrows in panels (G) and (I) indicate where 2–77 clashes with the binding pocket of BRD9 and BRPF1B, respectively. Figures created with PyMOL.
