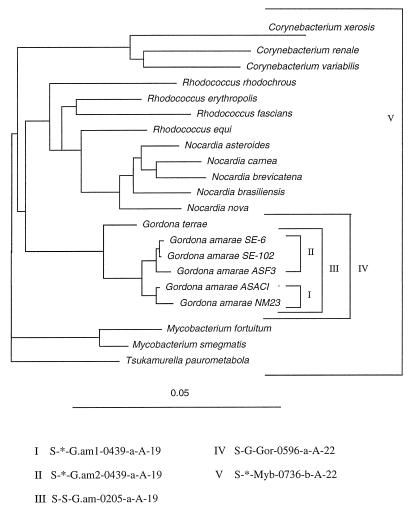
FIG. 3.
Phylogenetic tree showing the positions of representative mycolata, inferred from a comparison of SSU rRNA sequences. The tree was constructed by using a neighbor-joining method. The bar represents 5 estimated changes per 100 nucleotides. The oligonucleotide probes are shown with their respective target groups. Probes I, II, and III were designed in this study; probes IV and V have been described previously (17).

