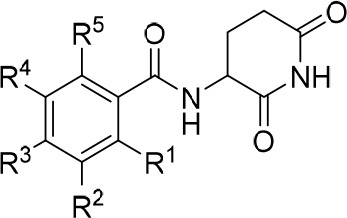
Table 1. Chemical Structures, Binding Data, Distribution Coefficients, Plasma Protein Binding Properties, and Phospholipid Interaction Capabilities of Benzamides 6 and 8.

| Ligand | R1 | R2 | R3 | R4 | R5 | IC50 (μM)a | Ki (μM)a | elog D7.4b | PPB (%)c | CHIIAMd |
|---|---|---|---|---|---|---|---|---|---|---|
| 2 | 13 ± 2.7 | 3.3 ± 1.4 | 0.5 | 51 | –4.0 | |||||
| 3 | 19 ± 1.5 | 6.4 ± 0.8 | –0.4 | 12 | –2.6 | |||||
| 6a | H | H | H | H | H | 127 ± 40 | 63 ± 21 | –0.3 | 10 | 6.3 |
| 6b | F | F | F | F | H | 65 ± 26 | 30 ± 14 | 0.9 | 17 | 16.7 |
| 8a | H | NH2 | H | H | H | 107 ± 45 | 53 ± 24 | –1.2 | 4 | –1.1 |
| 8b | F | NH2 | H | H | H | 93 ± 19 | 45 ± 9.9 | –1.2 | 4 | 0.7 |
| 8c | H | H | NH2 | H | H | 86 ± 21 | 41 ± 11 | –2.0 | 3 | –1.1 |
| 8d | F | H | NH2 | H | H | 63 ± 16 | 29 ± 8.2 | –0.7 | 5 | 5.2 |
| 8e | H | H | H | H | NH2 | 74 ± 14 | 35 ± 7.0 | –0.5 | 9 | 6.2 |
| 8f | F | H | H | H | NH2 | 114 ± 60 | 56 ± 31 | –0.1 | 12 | 8.1 |
Affinity values determined in a competitive MST assay as described in the methods sections. For comparison, pomalidomide (2) and lenalidomide (3) were included, for which data is from ref (30).
Distribution coefficients at pH 7.4 were estimated by an HPLC-based method.
Plasma protein binding; experimentally determined percentage of compound bound to human serum albumin.
Chromatographic hydrophobicity index values referring to IAM chromatography (CHIIAM values), an estimate for drug–membrane interactions and permeability.
