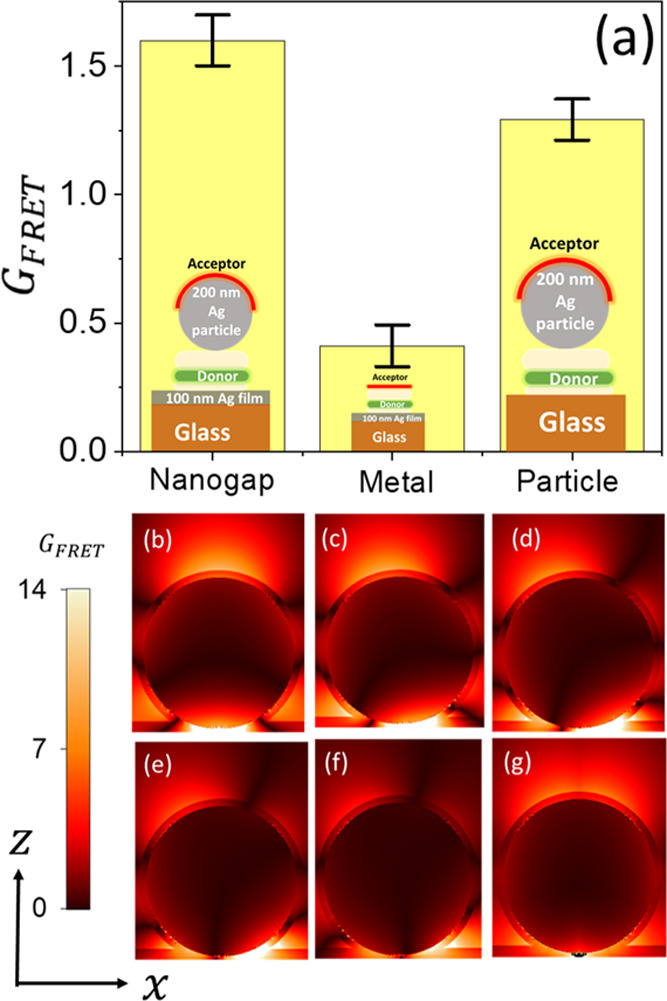
Figure 5.

(a) Measured normalized FRET rate  for donor–nanogap–acceptor
structure of 50 nm gap width and a silver particle of 200 nm diameter,
glass–donor–acceptor–200 nm silver particle,
and metal–donor–acceptor structures. (b–f) Calculated
normalized FRET rate
  as a function of the donor location in
the plane of the nanogap (x = 0, 25, 50, 75, and
100 nm) at the donor emission wavelength λdonor =
516 nm. (g) GFRET map averaged over the
donor location.
