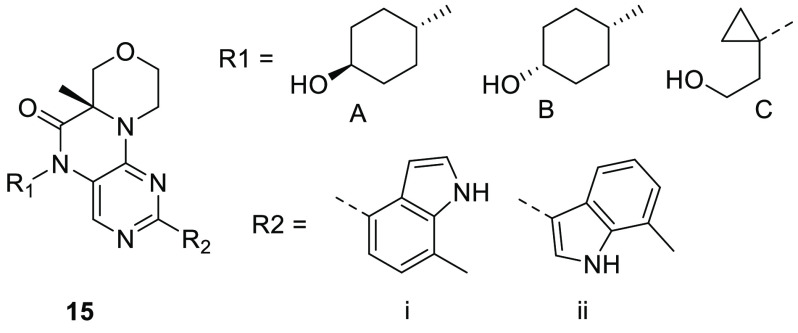
Table 3. New Combinations from Free–Wilson Analysis.
| R1 | R2 | mTOR IC50/nM (pred)a | PI3Ka sel. (pred)b | pAKT S473 cell IC50/nM | HLM Clint mL min–1 kg–1 | CYP IC50/μMc | |
|---|---|---|---|---|---|---|---|
| 15a | A | i | 10 (17) | 980× (380×) | 12 | 6 | 5d |
| 15b | A | ii | 10 (15) | 1000× (380×) | 7 | 7 | 3 |
| 15c | B | i | 12 (25) | 800× (220×) | 18 | 8 | 3 |
| 15d | B | ii | 13 (22) | 740× (220×) | 9 | 7 | 0.8 |
| 15e | C | ii | 7.1 (11) | 1400× (1900×) | 5 | 6 | 1.3 |
Predicted mTOR enzyme IC50 value from Free–Wilson analysis.
Predicted selectivity based on the ratio of the predicted PI3Ka enzyme IC50 over the predicted mTOR enzyme IC50 as described in ref (10).
The CYP IC50 value with the most potent inhibition was 2C8 unless otherwise noted.
CYP-2C9.

