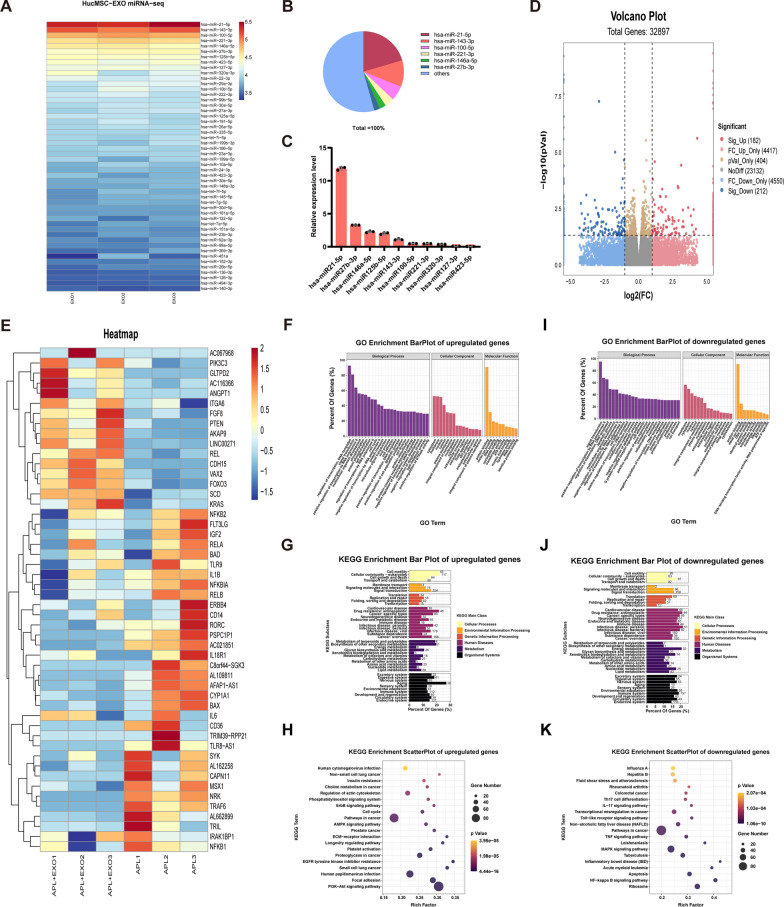
Fig. 3.
MiRNA sequencing analysis of hucMSC-exos and comprehensive analysis of genes and pathways involved in hucMSC-exos treatment based on mRNA high-throughput sequencing. A Heatmap of the top 50 most-enriched miRNAs expressed in hucMSC-exos (n = 3). B Relative percentage of miRNAs in total miRNA reads. C qRT-PCR analyzed the expression levels of the top 10 most-enriched miRNAs in hucMSC-exos (n=3). D Volcano plot of RNA-seq transcriptome data displaying the pattern of the gene expression profile in the HTR8/SVneo cells with or without hucMSC-exos treatment. The aPL + EXO group was incubated with hucMSC-exos (100 ug/ml) for 24 h post aPL stimulation (200 ug/ml). Red and blue dots indicate the significantly up- or down-regulated genes, respectively. p < 0.05, |log2FC|> 1. E Representative heatmap of differentially expressed genes between the aPL + EXO group and aPL group based on the above mRNA-seq data. (Red, relatively upregulated expression; blue, relatively downregulated expression). Each column represents one individual sample, and each row represents one single gene (n = 3). F-K Gene Ontology and Kyoto Encyclopedia of Genes and Genomes enrichment analysis of the up- and down-regulated genes in HTR8/SVneo cells of aPL + EXO group compare with aPL group. Gene percentage refers to the percentage of genes that were significantly enriched in the corresponding secondary class. Rich factor indicates the up-regulated and down-regulated expressed genes divided by the total number of genes. The smaller the p value, the higher enrichment degree. The diameter of the dots indicate the number of genes enriched in the corresponding signal pathways

