Fig. 7.
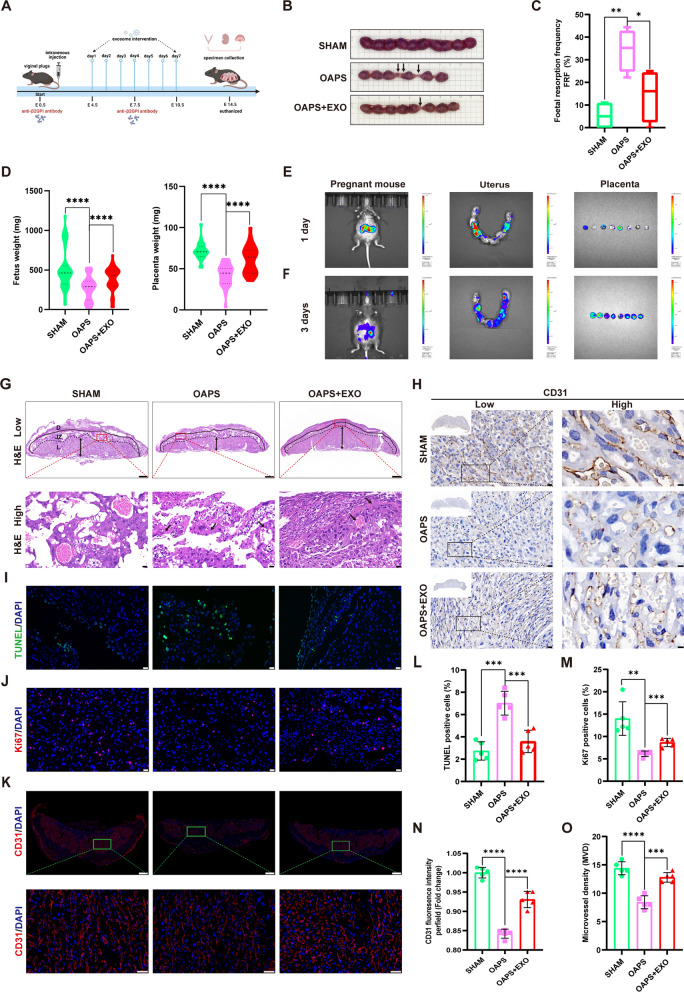
HucMSC-exos attenuated placental dysfunction in mice with antiphospholipid antibody syndrome. A Schematic illustration of OAPS mice model and therapeutic experiments. B Representative photographs of uterus morphology on E14.5, arrows represent the fetal absorption. C Fetal resorption frequency was assessed at E14.5. D Statistical analysis of fetal and placental weight in the three groups of mice. E and F In vivo imaging showed the DIR-labelled hucMSC-exos can be traced in the uters and placentas after 1 day and 3 consecutive days of tail vein injection. G Representative low- and high-magnification images of H&E-stained cross sections of placentas, the arrows point out the necrosis area and diseased blood vessel (decidua basalis (D); junctional zone (JZ); labyrinth (L)). Scale bars, 500 µm and 20 µm. H and O Representative low- and high-magnification images of IHC of CD31 and the microvessel density statistics of placental blood vessels (n = 5). Scale bars, 20 µm and 5 µm. I and L Representative images of TUNEL assay showing the apoptotic cells of mice placenta (TUNEL, green; DAPI nuclear stain, blue), quantified by the proportion of TUNEL+ cells (n = 5). Scale bars, 50 μm. J and M Representative images of Ki67 assay showing the proliferative cells of mice placenta (Ki67, red; DAPI nuclear stain, blue), quantified by the proportion of Ki67+ cells (n = 5). Scale bars, 50 μm. K and N Immunofluorescence of CD31 in mice placenta (CD31, red; DAPI nuclear stain, blue) and quantified by fluorescence intensity (n = 5). Scale bars, 50 μm. *p < 0.05, **p < 0.01, ***p < 0.001, ****p < 0.0001

