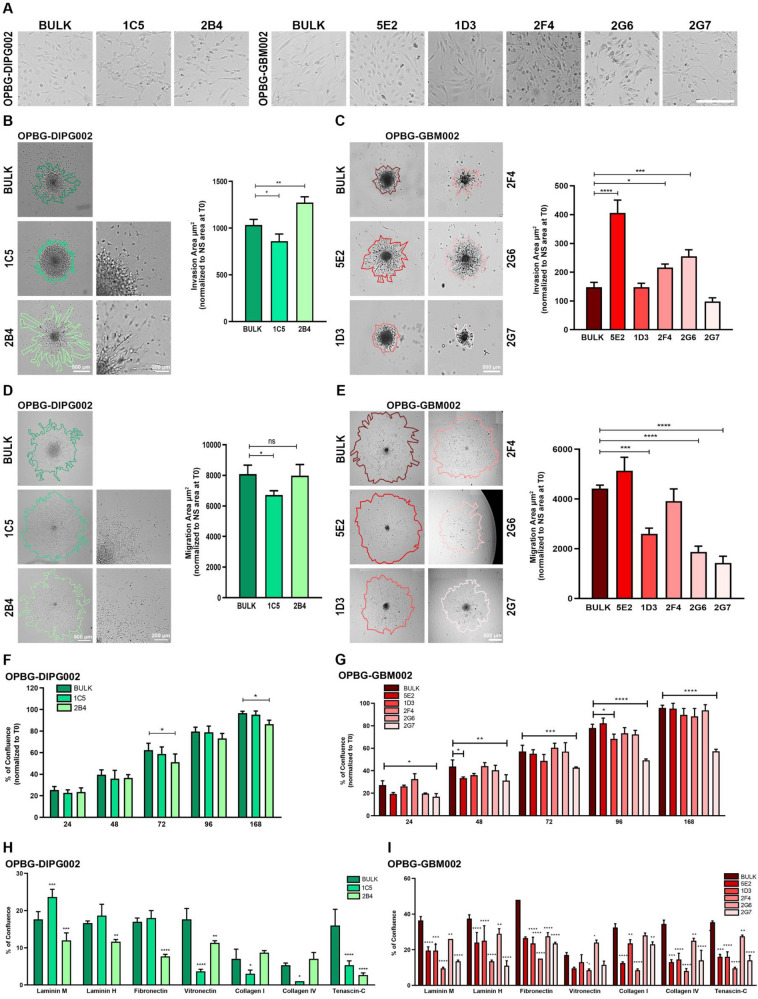
Fig. 1.
Single-cell-derived clones display different phenotypic features. A Representative brightfield images of the OPBG-DIPG002 and OPBG-GBM002 patient-derived and the clone cell morphologies. Scale bar = 100 μm. B, C Invasion assay was performed for 96 h with the patient-derived cells OPBG-DIPG002 (B) and OPBG-GBM002 (C) and with the respective derived clones. Brightfield images were segmented as indicated to quantify the invaded area as reported on the graph bar. Scale bar = 500 μm and 200 μm. D, E Representative images of the migration assay performed onto Matrigel for 96 h with cells of OPBG-DIPG002 (D), OPBG-GBM002 (E) and the respective derived clones. Brightfield images were segmented as indicated to quantify the migration area as reported on the graph bar. Scale bar = 500 μm and 200 μm. F, G Graph bar representing the results of the cell proliferation assay performed with OPBG-DIPG002 (F), OPBG-GBM002 (G) and the respective derived clones. After seeding, brightfield images were acquired at the indicated times and cell confluency was determined as described in the material and methods. The percentage of cell confluence corresponds to the cell confluency at the indicated time point normalised to the confluency at the time zero (t0). H, I Graph bar representing the results of the OPBG-DIPG002 (H), OPBG-GBM002 (I) and the derived clone cell adhesion assays using the 7 indicated extracellular matrices. All brightfield images were acquired and analysed with the Celigo imaging cytometer and are representative of 3 independent biological repeats. Data are mean ± SD, n = 3. (****) p < 0.0001; (***) p < 0.001; (**) p < 0.01; (*) p < 0.05

