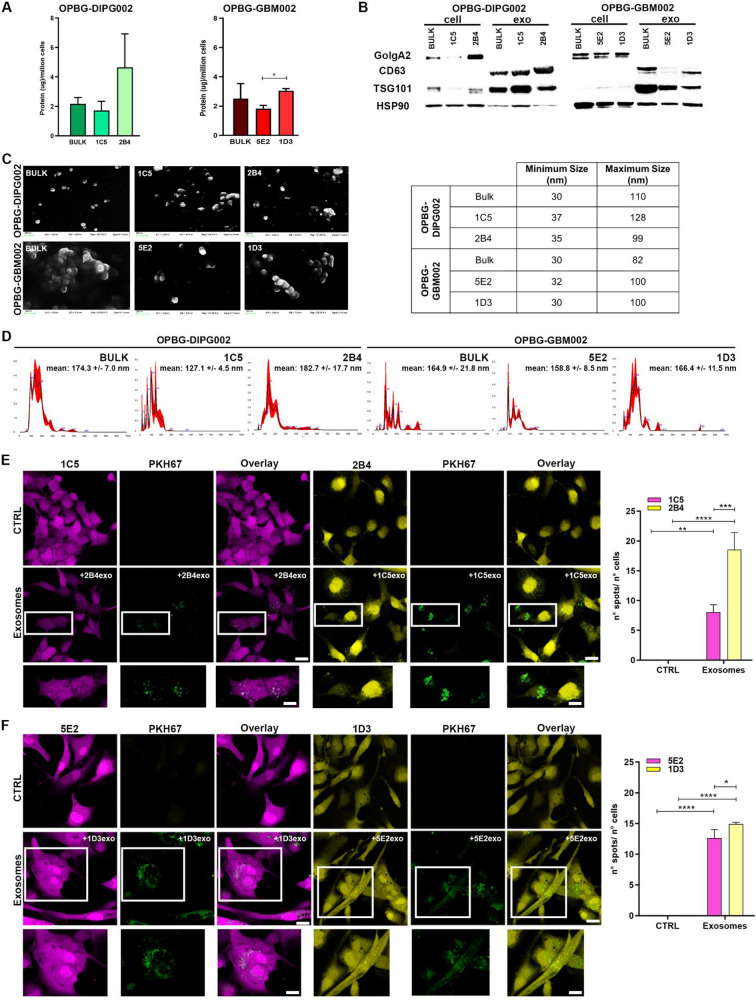
Fig. 4.
Primary characterization of exosomes and their cellular uptake. A Determination of the exosomal protein concentration. The quantification of the total exosomal protein obtained from 106 cells of OPBG-DIPG002 and OPBG-GBM002 and of the derived clones is shown. B The characterization of the exosomes from the different cell lines and derived clones as in (A) was carried out by Western Blot for the exosomal markers, CD63 and TSG101, and non-exosomal and cell membrane marker GolgA2. HSP90 was used as the loading control. C Images of the Scanning Electron Microscopy show a population of heterogeneously sized exosomes isolated from the OPBG-DIPG002 and OPBG-GBM002 cell lines and the from the respective clones. Scale bar = 200 nm. The table shows the minimum and maximum size of isolated exosomes. D Graphics representing the size distribution of the nanoparticles resulting from the NanoSight particle-tracking analysis performed with the exosomes obtained from OPBG-DIPG002 and OPBG-GBM002 and the derived clones culture medium. E–F Representative images of the exosome uptake experiments carried out with the clones derived from OPBG-DIPG002 (E) and OPBG-GBM002 (F). The recipient clone was cultured for 24 h in the presence of 10 µg/mL PKH67-labelled exosomes isolated from the donor clone. Graph-bar represent the quantification of the PKH67 fluorescent spots by cells, corresponding to the number of PKH67-labelled exosomes internalized by cells, as determined using the Harmony software. Scale bar = 20 μm and 10 μm. Data are mean ± SD, n = 3. (****) p < 0.0001; (***) p < 0.001; (**) p < 0.01; (*) p < 0.05

