Fig. 1.
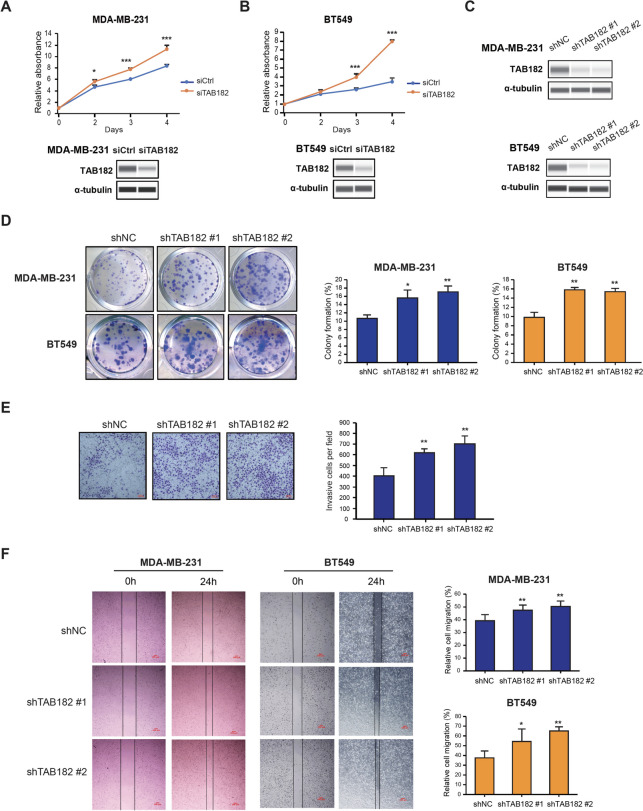
TAB182 deletion promotes cell growth, colony formation, migration, and invasion in TNBC cells. A-B CCK-8 cell proliferation assay was performed using TAB182 knockdown (siTAB182) or negative control (siCtrl) MDA-MB-231 cells (A) or BT549 cells (B) at the indicated time points. The knockdown of TAB182 was verified using Western blot analysis with the anti-TAB182 antibody. α-tubulin was used as the loading control. C Western blot analysis of TAB182 protein levels in stable TAB182 KD cells (shTAB182 #1 and shTAB182 #2) and control cells (shNC). α-tubulin was used as the loading control. D Cell colony formation assay revealed that TAB182 KD increased the colony formation ability compared with shNC cells, which was measured after seven days of incubation. The percentages of colony formation are presented in the right panel of D. E As determined with a Transwell assay, TAB182 depletion significantly promoted the invasion ability of MDA-MB-231 cells compared with shNC cells. Scale bar: 100 μm. Quantification data are presented as bar plots in the right panel of E. F The migratory ability of shTAB182 #1, shTAB182 #2, and shNC cells was measured by wound healing assay at 0 h and 24 h. Representative photos (10 × magnification, scale bar: 100 μm) and the relative cell migration percentages are presented as bar plots in the right panel of F. * P < 0.05, ** P < 0.001 by Student’s t test. Error bars represent SD (n = 3)

