Fig. 2.
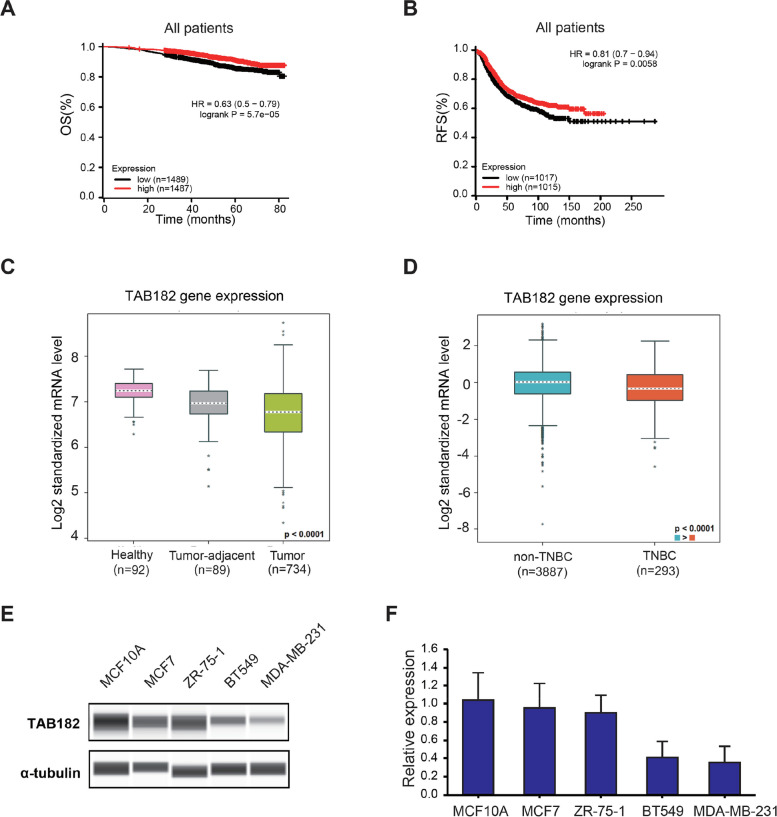
TAB182 expression is downregulated in TNBC cells. A-B Kaplan‒Meier plots showing the probability of overall survival (OS) (A) and relapse-free survival (RFS) (B) in all breast cancer patients, who were stratified on the basis of the median TAB182 (224792_at) gene expression level. C-D TAB182 mRNA levels among healthy, tumor-adjacent, and tumor samples (C). TNBC samples express lower mRNA levels of TAB182 than non-TNBC samples D. Analysis was performed using the TCGA RNA-seq databases from bc-GenExMiner v4.9. The P value shown in the figure indicates a significant global difference among three groups (C) or two groups (D). For each pairwise comparison (C), tumor-adjacent vs. healthy, P < 0.0001; tumor vs. healthy, P < 0.0001; tumor vs. tumor-adjacent, P < 0.01. E Western blot analysis results revealed TAB182 protein levels in a normal breast cell line (MCF10A), non-TNBC cell lines (MCF7 and ZR-751), and TNBC cell lines (BT549 and MDA-MB-231). F RT‒qPCR was used to determine TAB182 mRNA levels in the same cell lines shown in E. mRNA levels are relative to the mRNA expression of TAB182 in MCF10A cells. The data are shown as the means with SD (n = 3)

