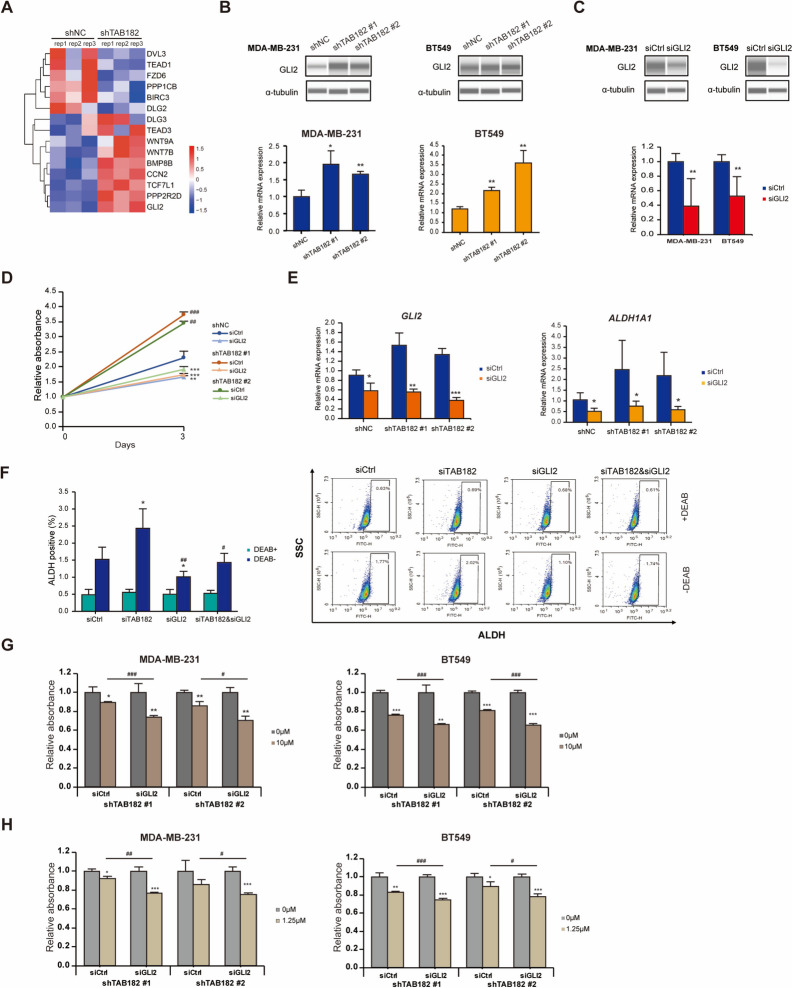
Fig. 6.
TAB182 deletion drives olaparib or cisplatin resistance by upregulating GLI2. A Heatmaps show the expression of a TAB182 deletion-regulated gene set enriched in the Hippo signaling pathway. The data are presented as transformed FPKM values of shTAB182 vs. shNC experiments. B The protein and mRNA levels of GLI2 upregulated by TAB182 knockdown were measured by Western blot analysis (top) and RT‒qPCR (bottom), respectively. α-tubulin was used as the loading control. The data are shown as the means with SD (n = 3). * P < 0.05, ** P < 0.01 by Student’s t test. C Knockdown of GLI2 significantly reduced GLI2 expression at both the protein (top) and mRNA levels (bottom) 72 h after siRNA transfection in MDA-MB-231 and BT549 TNBC cells. α-tubulin was used as the loading control. The data are shown as the means with SD (n = 3). ** P < 0.05 by Student’s t test. D CCK-8 assay using shTAB182 #1, #2, or NC cells, which were transfected with GLI2 (siGLI2) or control siRNA (siCtrl). After three days, OD was measured, and the absorbance values were compared relative to those obtained on Day 0. E RT‒qPCR analysis reveals that GLI2 or ALDH1A1 gene expression changes after GLI2 deletion in shTAB182 #1, #2, or NC cells. The data are shown as the means with SD relative to control (shNC cells transfected with siCtrl) from three independent experiments. * P < 0.05, *** P < 0.001, siGLI2 vs. siCtrl, by Student’s t test. F The proportion of ALDH-positive cells was determined using an ALDEFLUOR assay kit and GLI2-deleted shNC, shTAB182 #1, and shTAB182 BT549 cells, and it was followed by a flow cytometry analysis. DEAB was used as the negative control. SSC: side scatter. FITH: the fluorescence signal of ALDH. The percentages of ALDH-positive cells are presented in the left panel of F. * P < 0.05, ** P < 0.01, compared with siCtrl/Vec by Student’s t test. G-H siGLI2- or siCtrl-transfected stable TAB182 KD cells (shTAB182 #1 and shTAB182 #2) were treated with olaparib (Ola, 10 μM) (G) or cisplatin (Cis, 1.25 μM) (H). OD was measured 72 h after treatment, and the absorbance value obtained after DMSO treatment was used for normalization. The data are shown as the means with SD (n = 3). * P < 0.05, ** P < 0.01, *** P < 0.001, compared with DMSO; # P < 0.05, ## P < 0.01, ### P < 0.001, siGLI2 with Ola/Cis treatment vs. siCtrl with Ola/Cis treatment, by Student’s t test

