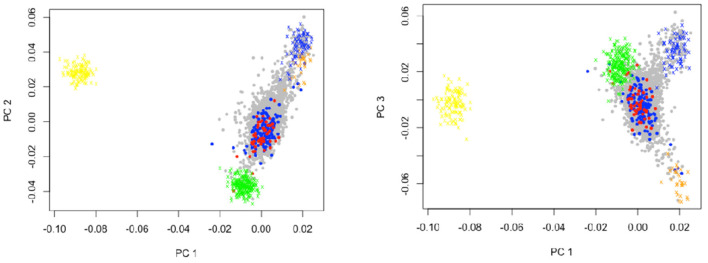
Figure 1.
Genetic principal component analyses of study individuals and Mapuche, European, African, and Aymara reference individuals. This figure shows the distribution of ancestry informative markers (ATMs) in the sample. PC1 distinguished Native American and European from Africans. The PC2 separated Native American from European ancestry components. CD and UC patients revealed greater European and Mapuche ancestry influences in our study population. The PC3 distinguished Mapuche from European and Aymara. Crosses represent reference populations, orange = Mapuche, blue = Aymara, green = European, yellow = African. Dark blue dots represent Ulcerative Colitis patients, and red dots Crohn's disease patients. PC = Principal Component.

