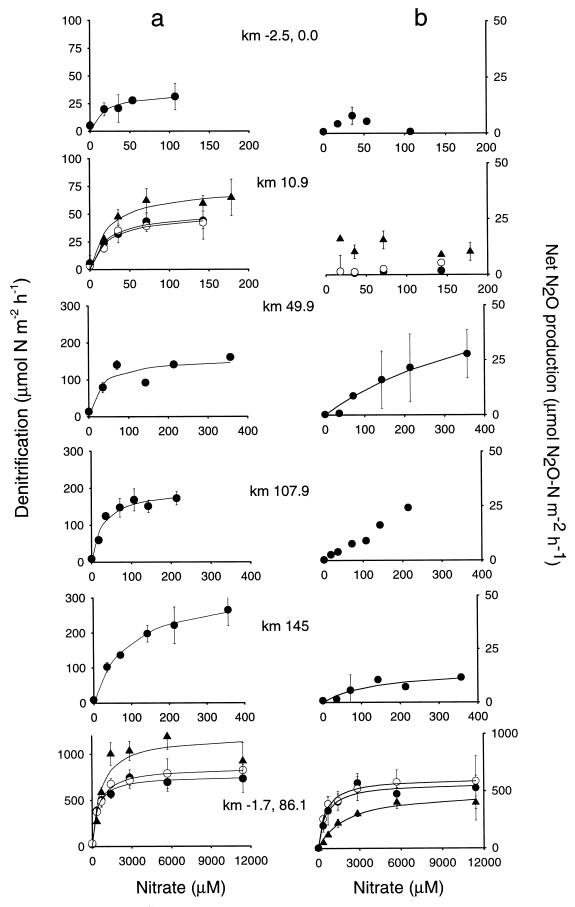
FIG. 2.
Responses of denitrification rate (a) and N2O production (b) to nitrate additions at the sampling sites in April 1997 (•). For the Ivelet Bridge (km 10.9) and Wiske sites the assays were repeated in June (○) and August (▴) 1997. The bars denote the standard deviations of three replicates. Note the different scales for denitrification rate, N2O production, and nitrate concentration.

