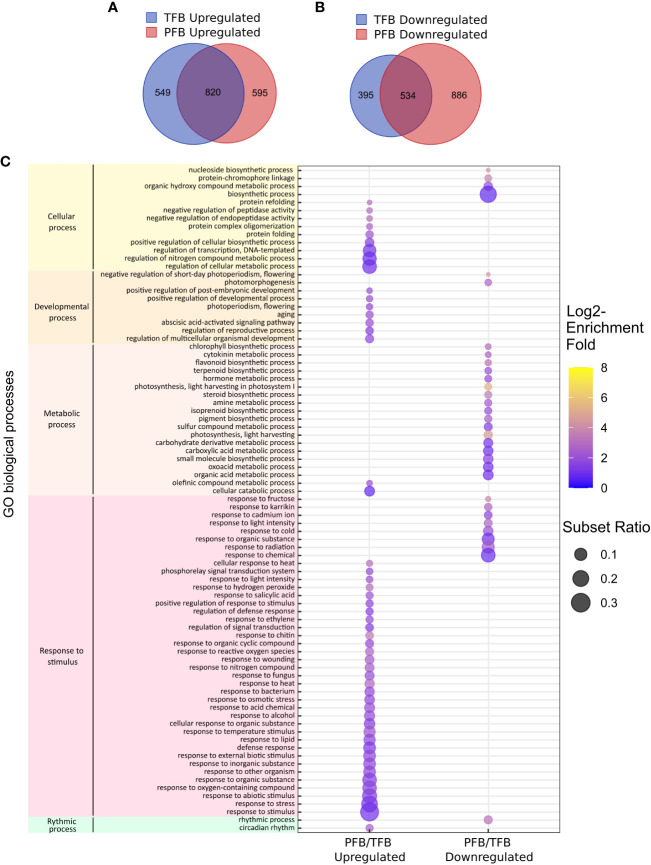
Figure 5.
Global transcriptome response to HS in all tomato cultivars. (A, B) Venn diagram presenting the overlap of DEGs between upregulated (A) and downregulated (B) genes between TFB and PFB stages in all cultivars. (C) Gene ontology (GO) enrichment analyses of the common DEGs between PFB and TFB. The dot size is representative of the number of DEGs associated with the process and the fold enrichment is according to a heat map (dot color).

