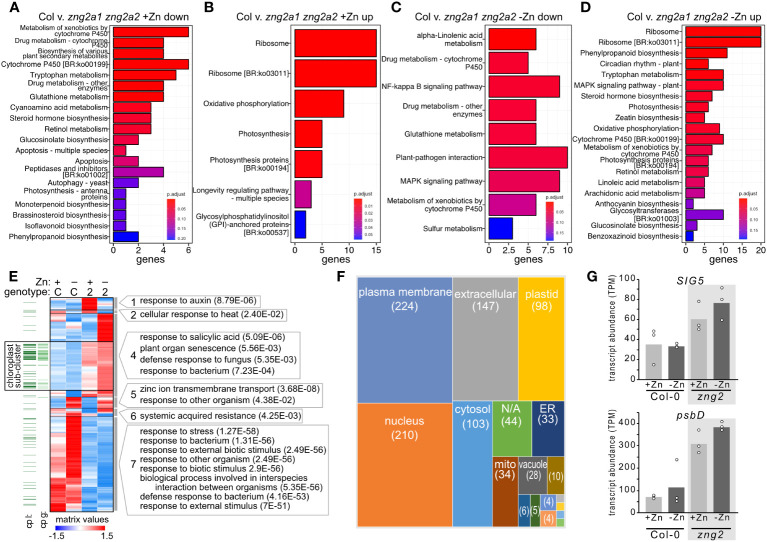
Figure 10.
Impact of zng2a1 zng2a2 mutation has a wide-ranging impact on the transcriptome with and without added Zn. (A, B) Top 20 significant KEGG pathways based on comparing the down-regulated and up-regulated genes in shoot samples between the Columbia (Col) and zng2a1 zng2a2 mutant with added Zn (Col v. zng2a1 zng2a2). (C, D) Top 20 significant KEGG pathways based on comparing the down-regulated and up-regulated genes in shoot samples between the Columbia (Col) and zng2a1 zng2a2 mutant without added Zn (Col v. zng2a1 zng2a2). (E) Heatmap of the 961 transcripts with statistically significant abundance differences in the comparisons between plus and minus Zn for the zng2a1 zng2a2 mutant (labeled “2”), and the zng2a1 zng2a2 mutant compared to Col-0 (labeled “C”) in either plus (labeled “+”) or minus Zn (labeled “-”). Proteins predicted to localize to the plastid “cp l” are indicated with a dark green line, while proteins encoded on the plastid genome “cp g” are indicated with a light green line. For each cluster, selected GO terms that are enriched (P value in parentheses) are shown. Cluster membership and order in the heatmap can be found in Table S8 . (F) A box plot comparing the number of putative localizations for the proteins encoded by transcripts in panel (E). “N/A” refers to proteins without a predicted localization in the Suba5 database. Boxes not labeled in the figure: brown, peroxisome; blue, golgi; green, cytosol/plasma membrane; light blue, vacuole/plasma membrane; orange, cytosol/nucleus; the unlabeled boxes have a single protein and represent extracellular/plasma membrane, mitochondrion/plastid, extracellular/endoplasmic reticulum, mitochondrion/cytosol, or golgi/plasma membrane. (G) Transcript abundance of SIG5 and psbD in the analyzed RNA-seq samples. Corresponding data can be found in Table S8 .

