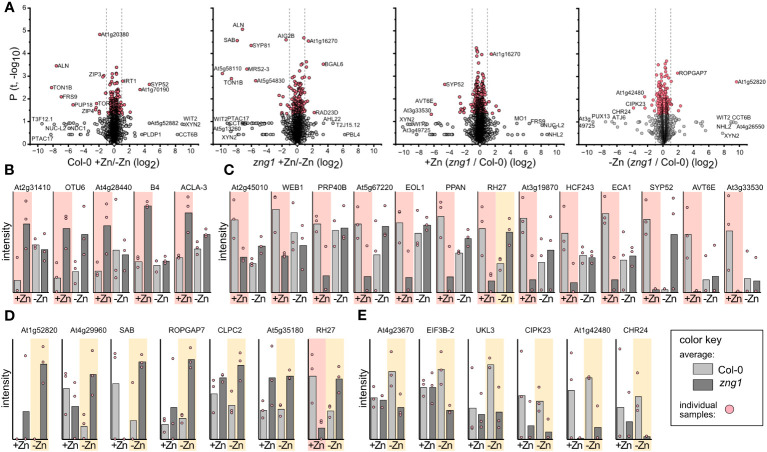
Figure 7.
Impact of zng1 mutation on the proteome. (A) Volcano plots of identified proteins in each comparison. Grey circles represent protein abundance changes with a P value > 0.05. Dotted lines represent the 2-fold cutoff. (B) In the presence of Zn, proteins that are higher in abundance in zng1 (P value <0.5, FC>2). (C) In the presence of Zn, proteins that are higher in abundance in Col-0 (P value <0.5, FC>2). (D) In the absence of Zn, proteins that are higher in abundance in zng1 (P value <0.5, FC>2). (E) In the absence of Zn, proteins that are higher in abundance in Col-0 (P value <0.5, FC>2). Note that RH27 is duplicated in panel (C, D).

