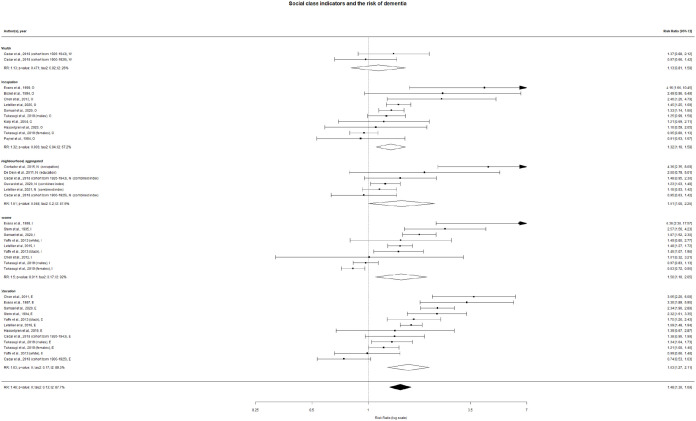
Figure 2.
Individual and pooled risk ratios of the association between the social status and dementia risk (forest plot), random effect. Letters after the authors’ names mean the indicators of social class (W: wealth; O: occupation; N: neighbourhood; E: education; I: income). In parentheses, for all the indicators except neighbourhood: the sub-cohorts; for the neighbourhood: the characteristic of the population by which the social class was attributed to the neighbourhood.

