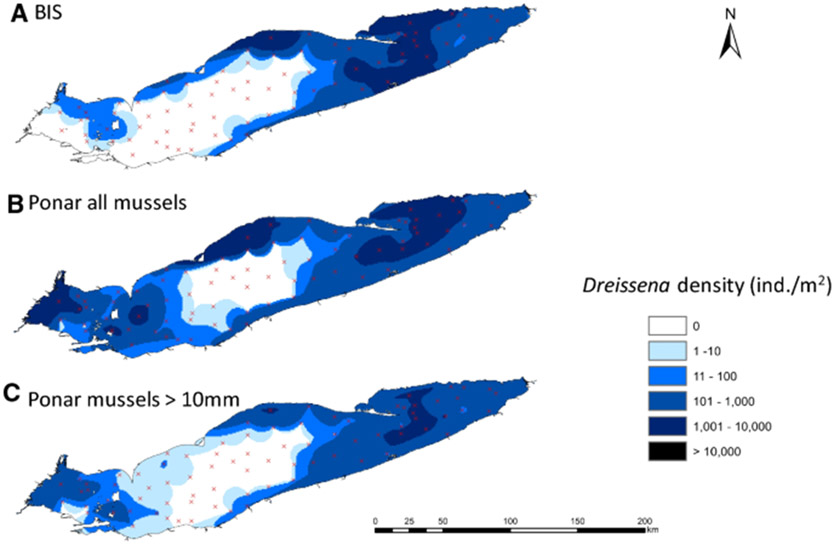
Fig. 4.
Spatial distribution of Dreissena spp. in Lake Erie in 2019 expressed as density (ind./m2) estimated by using BIS video image analysis (A) and Ponar samples including all Dreissena size classes (B), and mussels > 10 mm (C). Red crosses indicate sampling stations. Only the 81 matching stations where density data from both BIS and Ponar samples were available are shown

