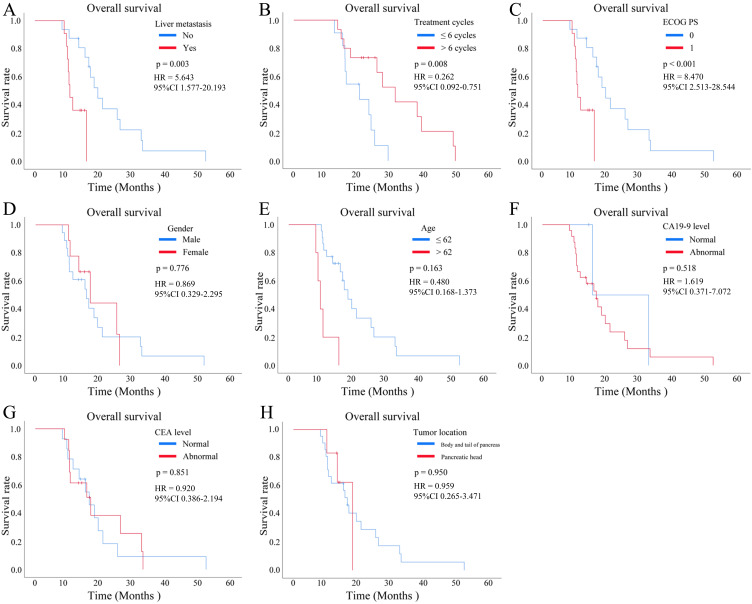
Figure 4.
Kaplan-Meier survival curves were plotted to analyze the overall survival (OS) of patients with pancreatic cancer who received a combination of gemcitabine plus nab-paclitaxel (GnP) chemotherapy and immunotherapy, stratified by different clinical subgroup. (A) OS according to the hepatic metastasis (yes vs no, p < 0.001). (B) OS according to the treatment cycles (<= 6 cycles vs >6 cycles, p = 0.008). (C) OS according to the Eastern Cooperative Oncology Group (ECOG) performance status (PS) (0 vs 1, p = 0.003). (D) OS according to the sex (male vs female, p = 0.776). (E) OS according to the age (<= 62y vs >62y, p = 0.163). (F) OS according to the carbohydrate antigen 19–9 (CA19-9) level (high vs low, p = 0.518). (G) OS according to the carcinoembryonic antigen (CEA) level (high vs low, p = 0.851). (H) OS according to the tumor location (body and tail of pancreas vs pancreatic head, p = 0.950).

