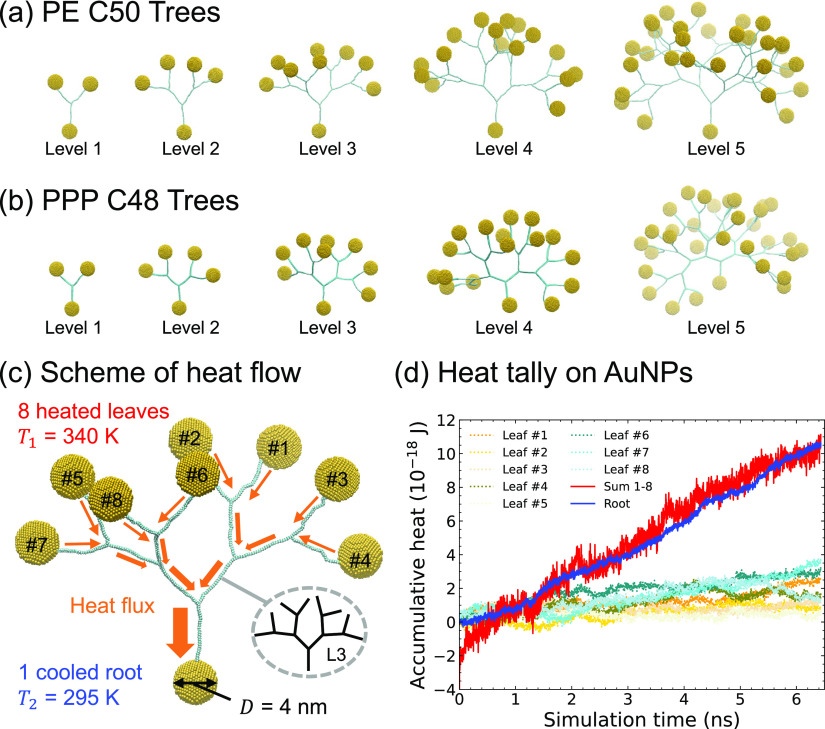
Figure 1.
Representative tree structures of PE trees and PPP trees from level 1 to 5 are shown in (a) and (b), respectively. When a AuNP is located deeper into the plane, it is shown in a lighter color, The underlying scheme for the heat conductance calculation up is shown in (c). Using the level 3 PE tree as an example, the 8 AuNP leaves on top are heat sources at 340 K and the 1 AuNP root at the bottom is the heat sink at 295 K. The tree branch lengths are all the same. PE branches are 50 carbons, and PPP branches are 48 carbons (12 rings). (d) The accumulative heat additions at the 8 different AuNP leaves are shown in 8 different colored dotted lines, and the energy subtraction at the 1 AuNP root is shown in blue. As noted in the text, the sum of the accumulated heat across all 8 leaves exceeds the energy subtraction by the initial transient energy addition needed to compensate the mismatch in heat capacities between the leaves and the root. The red curve thus displays the sum of the 8 leaves subtracted by this transient energy. (All colors are in grayscale in colorless prints and indicated by the legend.).

