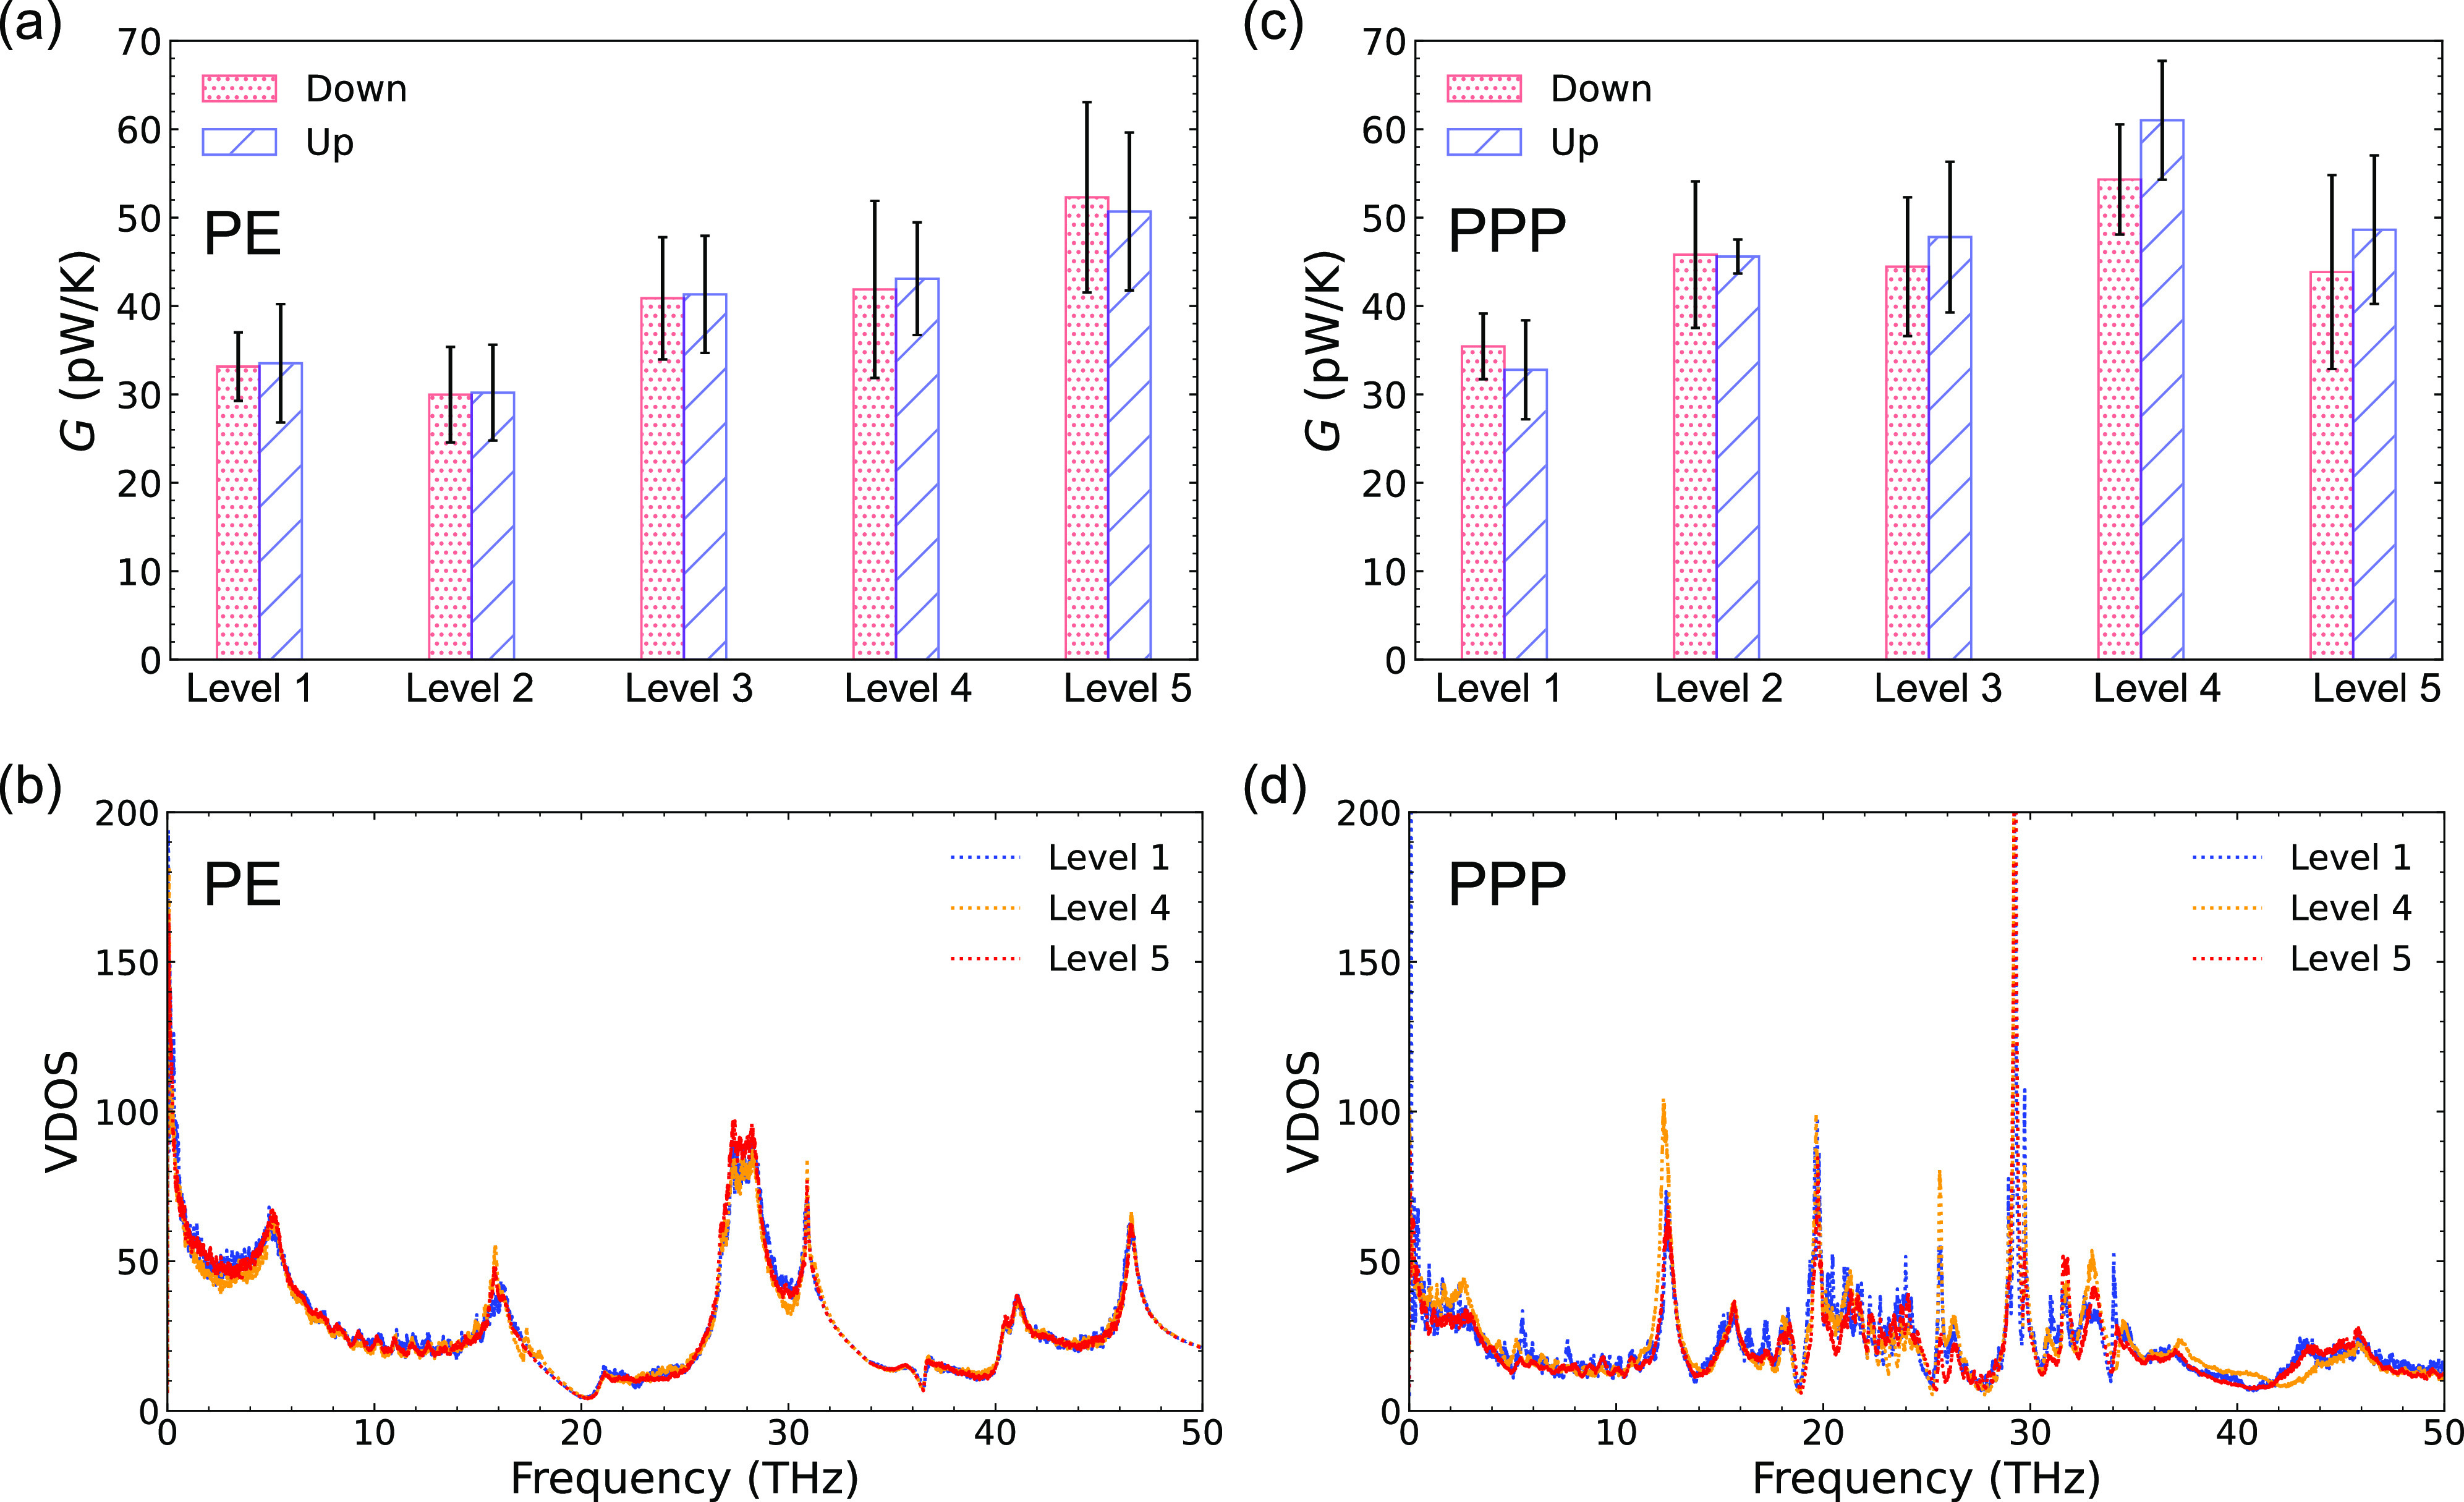
Figure 2.

(a) Heat conductance of PE C50 tree polymer networks from level 1 to level 5. (b) VDOS spectra of PE C50 tree level 1, level 4, and level 5 polymer networks. (c) Heat conductance of PPP C48 tree polymer networks from level 1 to level 5. (d) VDOS spectra of PPP C48 tree level 1, level 4, and level 5 polymer networks. The large error bar in heat conductance is due to the high uncertainty in single molecule systems, which is also found in experiments40 and similar simulation systems.41,42,45 The VDOS spectra are obtained from the Fourier transform of the velocity autocorrelation function, which is, in turn, calculated from 20 randomly selected carbon atoms within the middle of the polymer to avoid effects from the thermostats; see, e.g., the selection of carbon atoms shown in Figure S4 in the SI. Due to the uncertainty, the VDOS spectra are relevant only for qualitative comparison. For convenience, the VDOS for only three of the levels (as listed in the legends) is shown here. All five of the VDOS spectra over a wider frequency range (from 0 to 100 THz) are shown in Figure S5 in the SI. The y-axis of the VDOS spectra is in arbitrary units.
