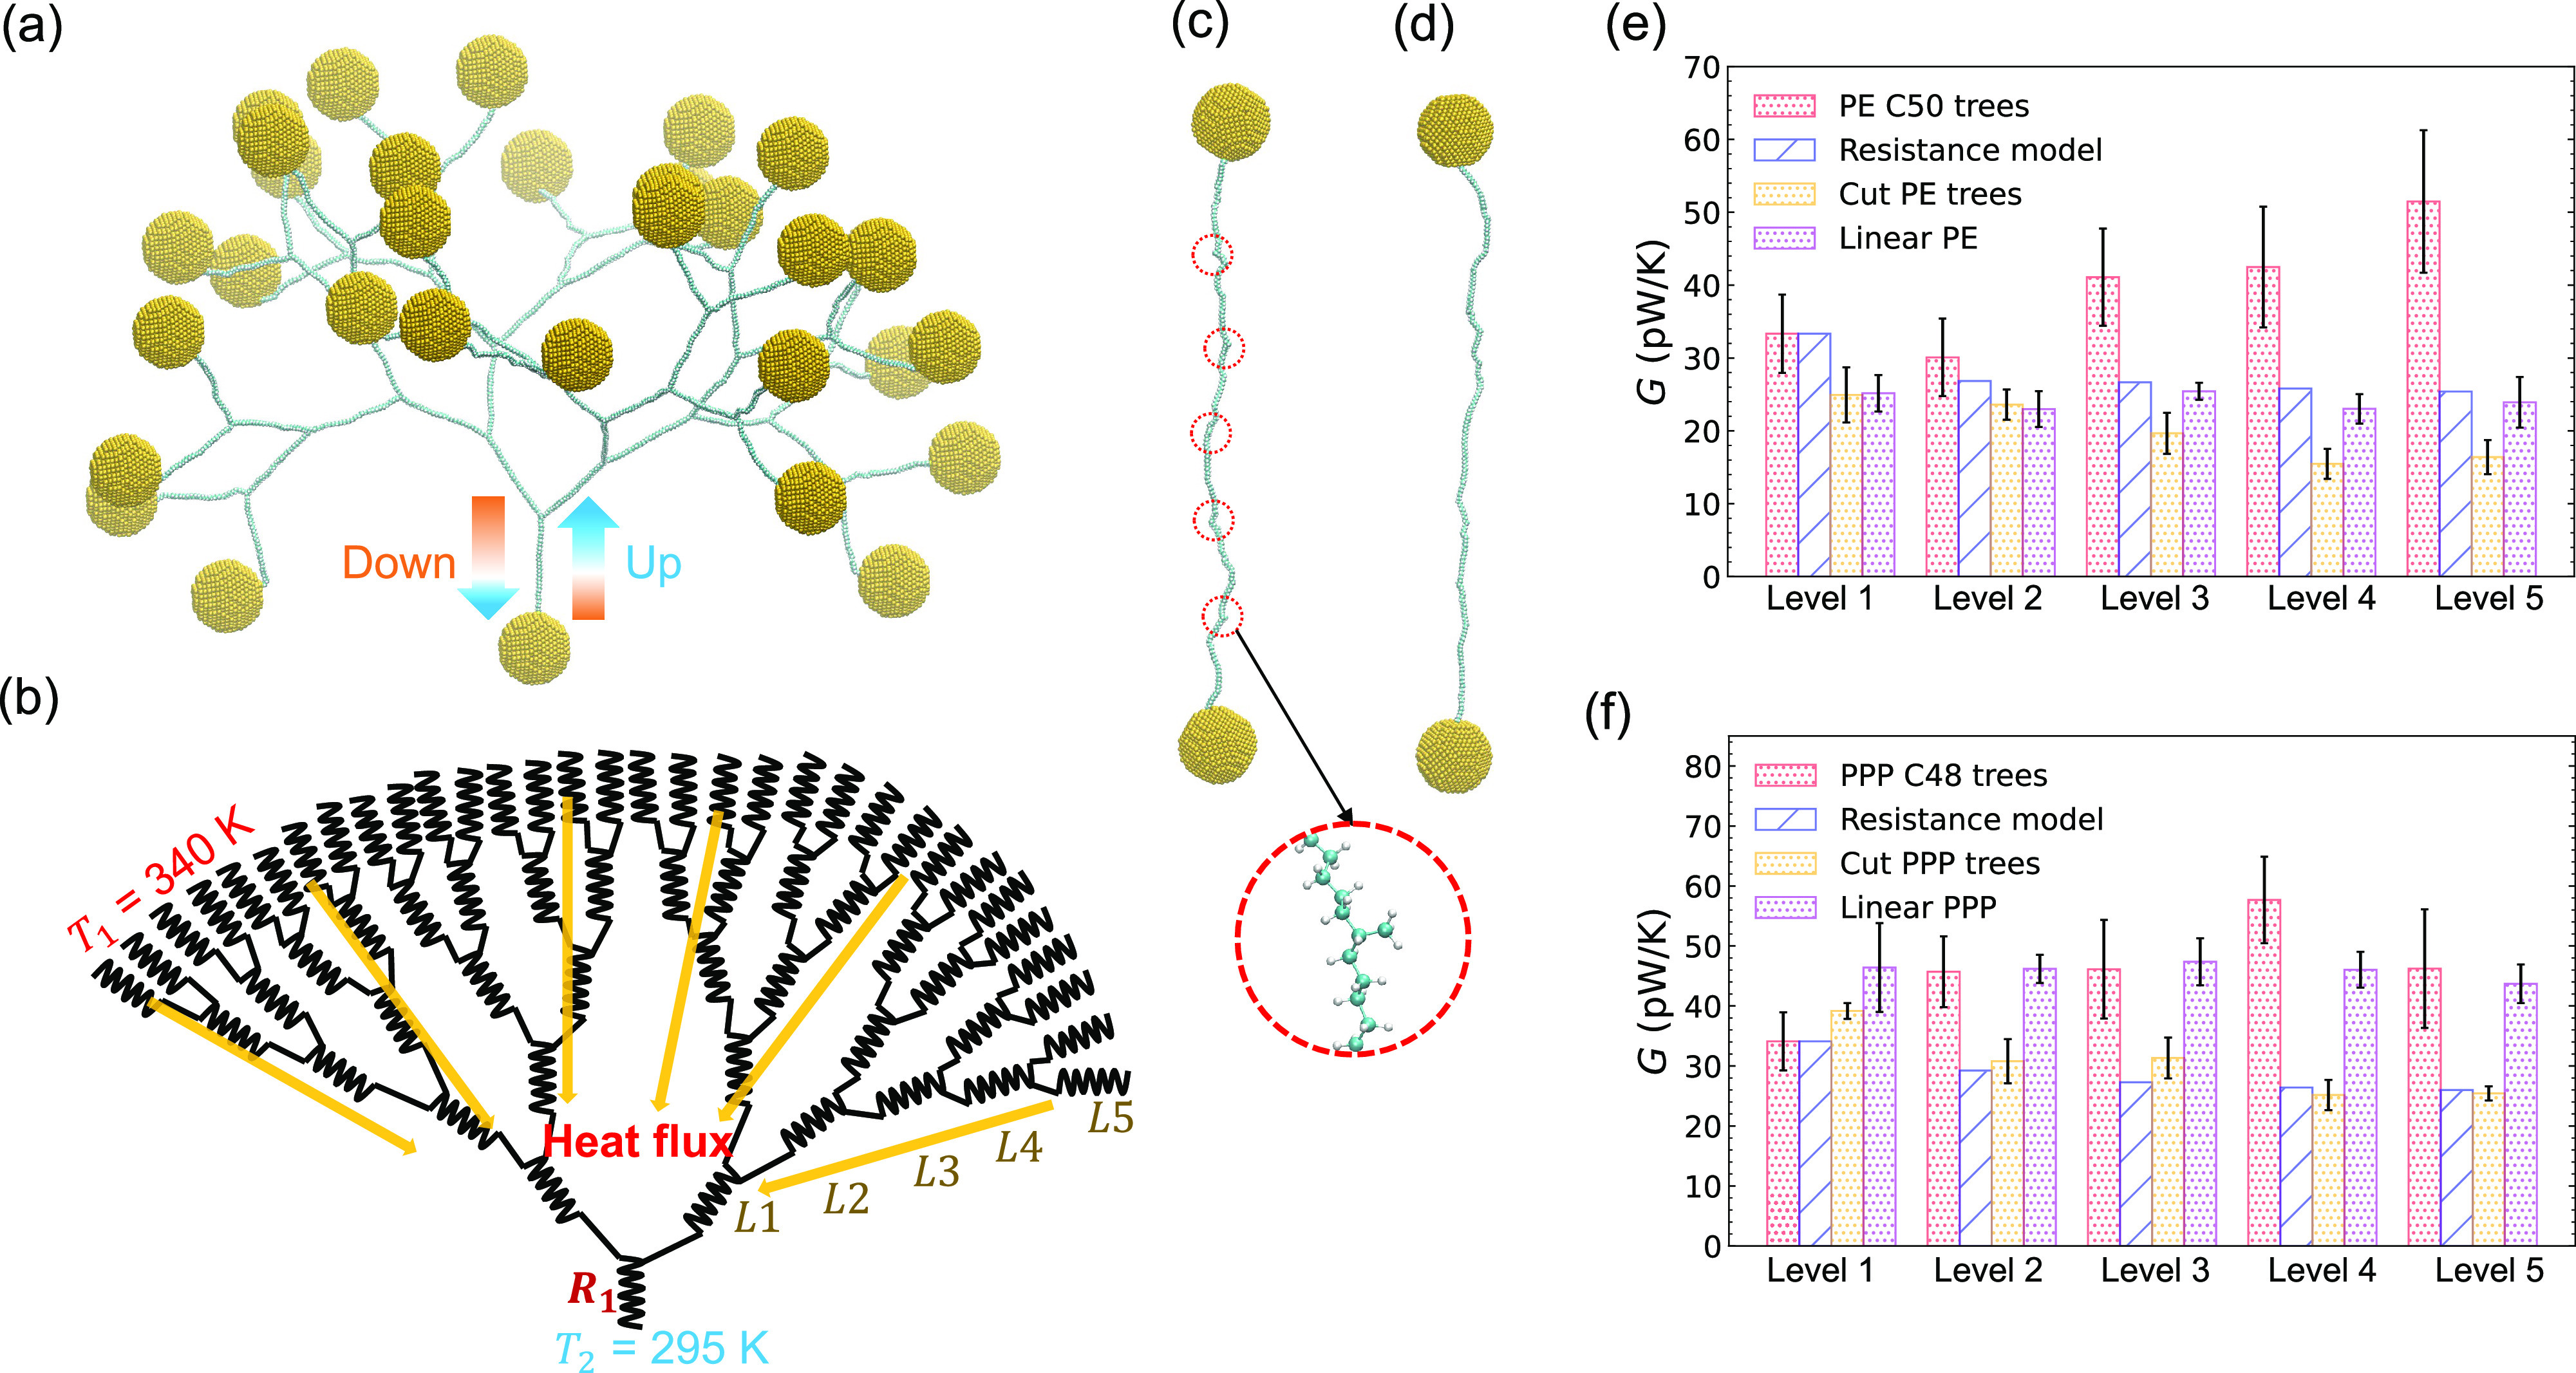
Figure 3.

Representative level 5 structures of (a) a PE tree MD simulation model, (b) a general thermal resistance model, (c) a PE cut tree (red circles indicate positions of the cut branches), and (d) a linear PE chain at 300 carbon length. The cut tree structure has one CH3 residue group at each of the branching positions. The heat conductance results of four models in (a)–(d) are compared in (e) and (f) for both PE and PPP networks, respectively. Schemes of cut tree structures are shown in parts S8 and S9 in the SI. The G values are averaged from both upward and downward heat flow results since no rectification is observed at this temperature gap.
