. 2023 Oct 24;52(22):7848–7948. doi: 10.1039/d0cs00936a

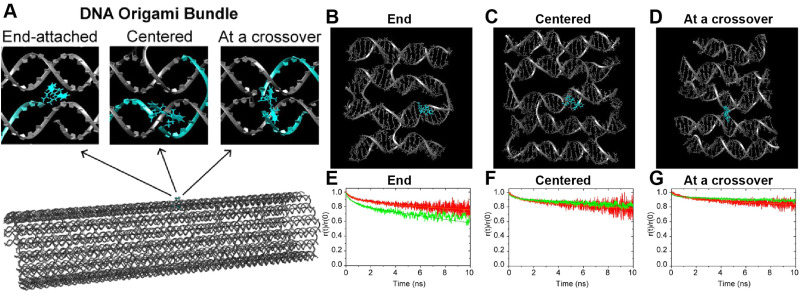
Fig. 11. MD analysis of dye orientation in a DNA origami bundle. (A) Schematic of the DNA bundle (grey) with one staple strand (cyan) including a dye in three configurations, namely, End-attached (Abundle), Centered (Ebundle), and At a crossover (Fbundle). (B)–(D) Snapshots of the local bundle structures (Abundle, Ebundle and, Fbundle, respectively) from the MD simulations. The position of the Cy3 molecule is shown in cyan color. (E)–(G) Comparison of simulated (green curves) and experimental (red curves) normalized time-resolved anisotropy for Abundle, Ebundle, and Fbundle. Solid curves are fits to the data. Reproduced with permission from ref. 113 Copyright 2021 American Chemical Society.

Fig. 11