. 2023 Oct 24;52(22):7848–7948. doi: 10.1039/d0cs00936a

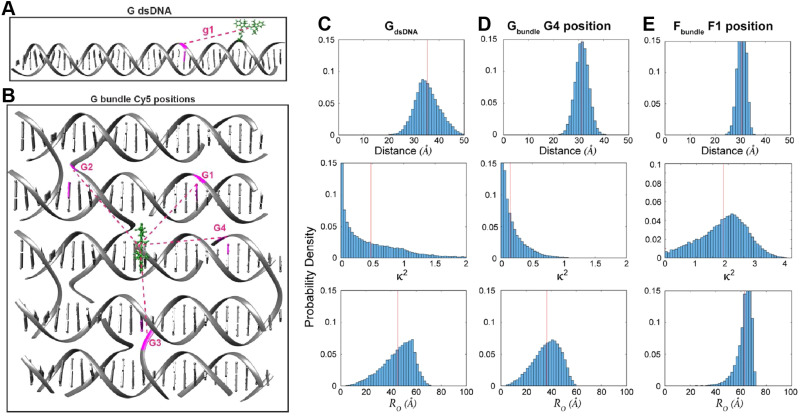
Fig. 12. MD-derived dye distance and orientation probability distributions. (A) A linear duplex and (B) DNA bundle shown in Fig. 11 were compared for the dye spacings, dipole orientation factors and R0 values for Cy3–Cy5 pairs. The Cy3 position is shown in green whereas Cy5 was simulated in particular locations namely g1 in the “G dsDNA” duplex and G1 through G4 sites in the DNA bundle fragment shown in (B). The inter-dye distance, orientation factor, and Förster radius change is shown for (C) g1 site, (D) G4 site, and (E) F1 site (the structure is not shown here). Reproduced with permission from ref. 113 Copyright 2021 American Chemical Society.

Fig. 12