. 2023 Oct 24;52(22):7848–7948. doi: 10.1039/d0cs00936a

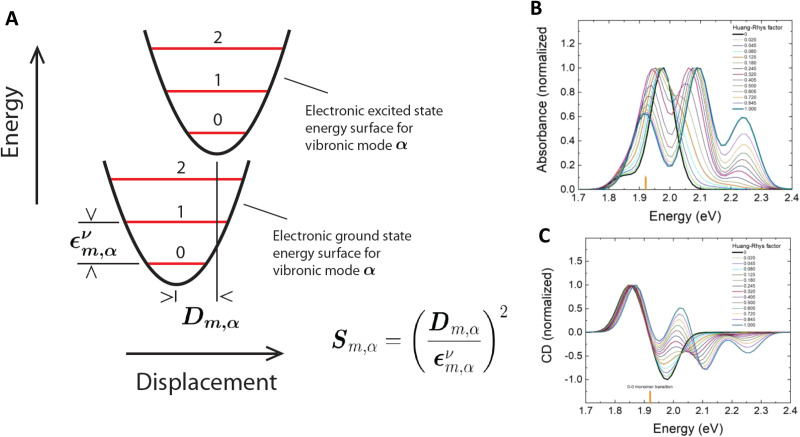
Fig. 14. KRM Model Simulations. (A) Graphical representation of the quantities εvm,α and Dm,α for vibronic mode α of dye m. εvm,α and Dm,α are extracted from optical data using the KRM Model Simulation Tool mentioned in the subsequent sections on exciton delocalization. Calculated (B) normalized absorbance spectra for increasing H-R factors starting from zero and (C) normalized CD spectra. Orientations and monomer properties held fixed. The vertical orange stick represents the 0-0 monomer transition energy of 1.92 eV. Unless the absorbance and CD are not perfectly electronic in nature (black curves) some degree of vibronic coupling is involved. Reprinted with permission from ref. 224 Copyright 2021 American Chemical Society.

Fig. 14