. 2023 Oct 24;52(22):7848–7948. doi: 10.1039/d0cs00936a

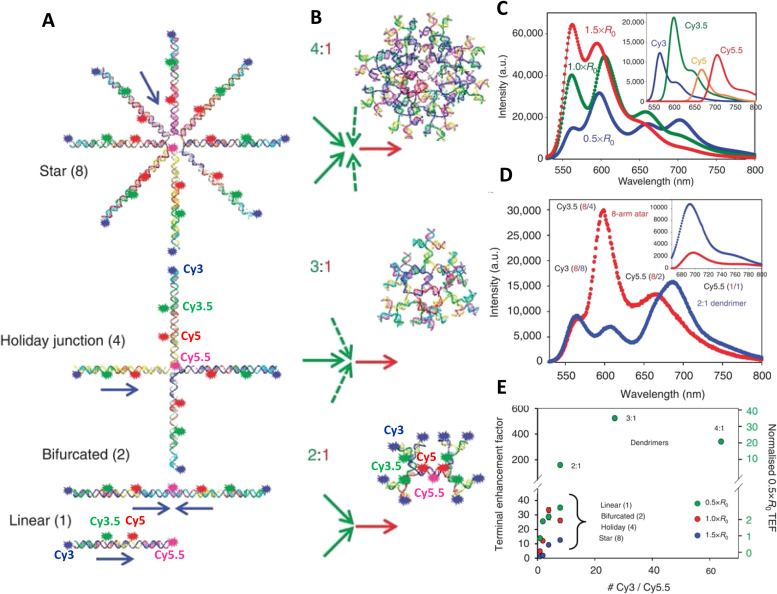
Fig. 24. Comparison of linear versus dendrimeric photonic wires. (A) Linear [Cy3 → Cy3.5 → Cy5]n → Cy5.5 four-dye, three FRET step systems with sequential donor–acceptor arrangements of Cy3 (blue), Cy3.5 (green), Cy5 (red) and Cy5.5 (pink) in photonic wire configurations. The number of [Cy3 → Cy3.5 → Cy5]n wires leading into each terminal Cy5.5 dye increases from one to eight using linear, bifurcated, HJ and eight-arm star constructs. Blue arrows indicate directionality of the FRET cascade(s) along each wire in each structure as they converge on the terminal Cy5.5 A. (B) Dendrimer-based FRET systems in configurations where each dye preceding the central-terminal Cy5.5 A has two, three, or four Ds. D–A spacing for the dendrimers fixed at 0.5 × R0. The linear, HJ, and 2 : 1 dendrimer structure show approximate dye locations. (C) Representative comparative spectral data for the 0.5 ×, 1.0 ×, and 1.5 × R0 linear systems. Data were normalized to the direct Cy5.5 emission at the same excitation. Inset: Decomposed individual component spectra for the 0.5 × R0 linear system. (D) Comparison of normalized emission for the 0.5 × R0 2 : 1 dendrimer and eight-arm photonic wire star structures. Dye ratios corresponding to each position in each structure are indicated with red or blue numbers in parenthesis. Inset: Decomposed Cy5.5 sensitization for the 2 : 1 dendrimer (blue) is much larger than for the eight-arm star (red). (E) Plot of Cy5.5 terminal enhancement factor (TEF) for the [Cy3 → Cy3.5 → Cy5]n → Cy5.5 photonic wire and the 2 : 1, 3 : 1 and 4 : 1 0.5 × R0 dendrimer structures as compared with the initial 1.5 × R0 linear system (left axis). Right scale plots TEF for only the 0.5 × R0 structures as compared with the 0.5 × R0 linear four-dye system. Reproduced from ref. 252 with permission from Springer Nature, copyright 2014.

Fig. 24