. 2023 Oct 24;52(22):7848–7948. doi: 10.1039/d0cs00936a

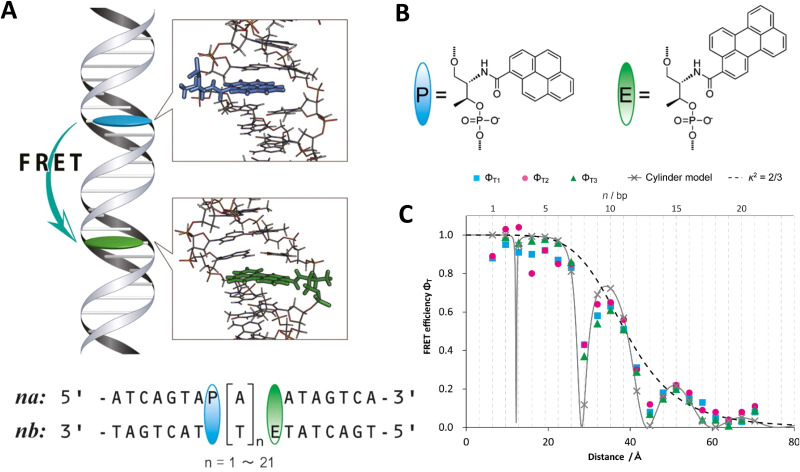
Fig. 26. Confirmation of dye position and orientation during FRET within DNA duplexes. (A) Top: Schematic of FRET system used in this study. Bottom: Sequence of FRET dsDNA pair. AT pairs were inserted between P (pyrene as D) and E (perylene as A). P and E moieties were introduced into strands na and nb, respectively, where n indicates the number of inserted A or T residues. (B) Structure of P and E fluorophores were directly conjugated via d-threoninol to the DNA strand. (C) Comparison of FRET efficiency obtained from static fluorescence measurement (ΦT1, cyan squares, ΦT2, magenta circles) and time-resolved fluorescence spectroscopy (ΦT3, green triangles) with theoretical values of cylinder model (gray line with cross symbols). The value of averaged orientation shown by dashed line. Reproduced with permission from ref. 111 Copyright 2013 American Chemical Society.

Fig. 26