. 2023 Oct 24;52(22):7848–7948. doi: 10.1039/d0cs00936a

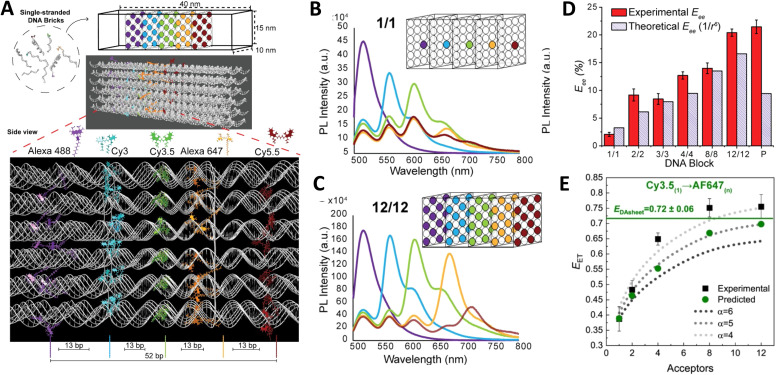
Fig. 27. Accessing sheet FRET in a DNA block assembly. (A) Schematic of the rectangular dye-labeled DNA block. Top: The DNA block self-assembles from ssDNA bricks into a prescribed 10 × 15 × 40 nm3 cuboidal structure shown schematically and as rendered in UCSF Chimera. Below: An enlarged side view highlighting the positioning of the five 2D planes arranged with an inter dye-plane separation of 13 bp. Each plane can display from 1 up to 12 dye copies with each dye copy positioned on alternating helices. The planes display Alexa 488, Cy3, Cy3.5, Alexa 647, and Cy5.5, respectively, to yield the full sequential initial D → relay → terminal A FRET cascade. (B) Steady-state fluorescence characterization of DNA blocks incorporating 1 (B) and 12 (C) ratios of dyes per plane. Each panel shows the evolution of spectra collected as downstream A dye(s) were added to the next plane in parallel assemblies. Nomenclature indicates the number of copies of each dye type incorporated in the structure, while the box structure schematically depicts this for the final plane-to-plane configuration. (D) Experimentally determined Eee estimated from steady-state fluorescence collected from fully labeled block assemblies (AF488 →→ Cy5.5) as the number of dye copies per plane is increased. Theoretical Eee assumes each D–A pair has a 1/r6EFRET distance dependency. (E) Experimental and predicted Eee values for a single Cy3.5 D to multiple A647 As distributed in a plane. The dashed curves are guides for the1/rαEFRET distance dependency exponent values of α = 4, 5, or 6. Predicted EDAsheet values show the predicted FRET in the sheet regime shown as the horizontal lines. Reproduced with permission from ref. 103 Copyright 2021 American Chemical Society.

Fig. 27