. 2023 Oct 24;52(22):7848–7948. doi: 10.1039/d0cs00936a

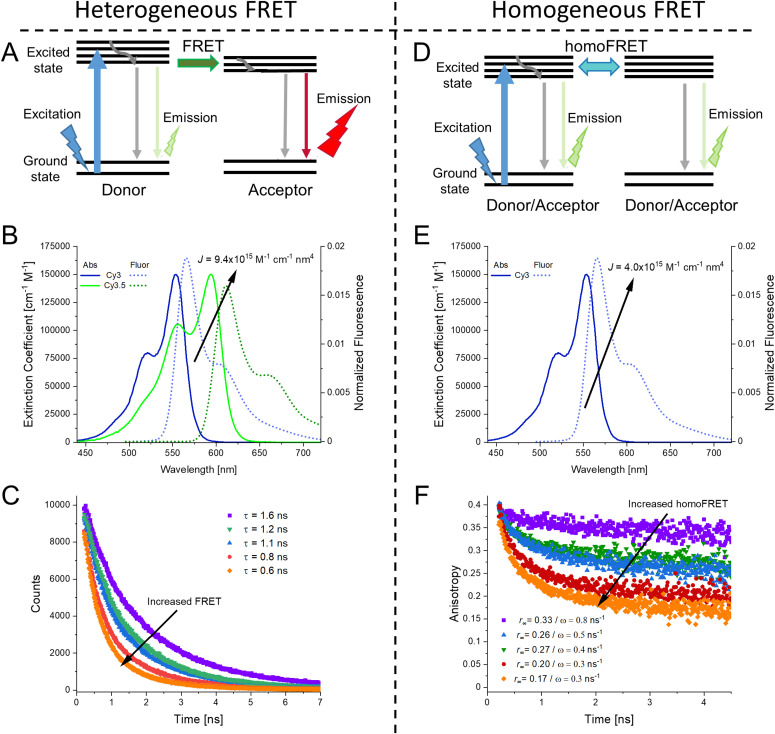
Fig. 32. Comparison of heterogeneous FRET and homogeneous FRET. (A) Jablonski diagram of heteroFRET, showing transfer from D to A and its subsequent emission. (B) Spectral overlap of Cy3-Cy3.5 D–A heteroFRET pair resulting in a J of 9.4 × 10¹⁵ M−1 cm−1 nm4. (C) Fluorescence lifetime of a donor molecule. As heteroFRET increases the average fluorescence lifetime, τ, decreases. (D) Jablonski diagram of homoFRET, the identical molecules can function as both D and A now. (E) Spectral overlap of Cy3-Cy3 D–A homoFRET pair resulting in a relatively smaller J of 4.0 × 10¹⁵ M−1 cm−1 nm4, though this is still reasonably good value for efficient FRET. (F) Fluorescence lifetime anisotropy of emitting molecules. See eqn (20) and (21) for how fitting values were derived. Fluorescence lifetimes are unchanged in the presence of homoFRET and, as such, the fluorescence lifetime anisotropy is necessary.

Fig. 32