. 2023 Oct 24;52(22):7848–7948. doi: 10.1039/d0cs00936a

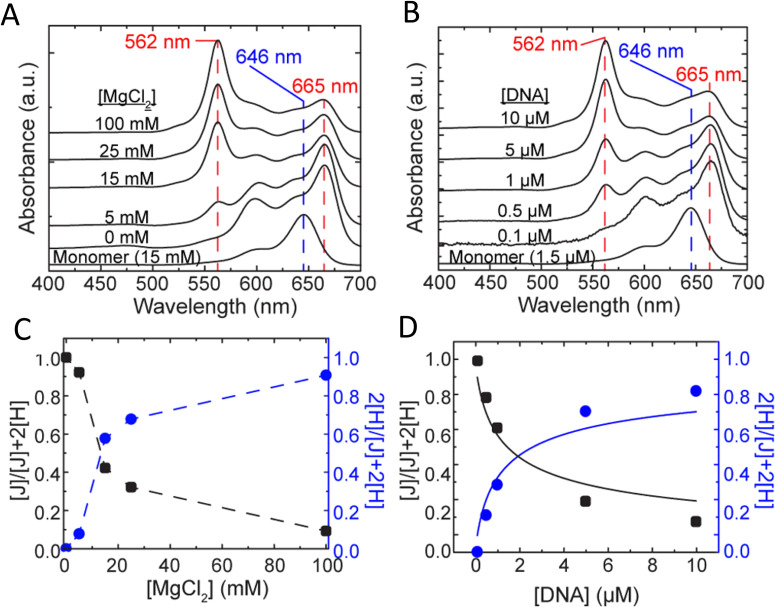
Fig. 41. Varying H- and J-aggregate structure with salt in DNA Holliday junctions (see Fig. 56 for HJ structure). Observed UV-vis absorbance spectra with varied (A) salt (DNA concentration held constant at 1.5 μM) and (B) DNA (added MgCl2 concentration held constant at 15 mM) concentrations. Changes in J-dimer (black squares and ordinate axes) and H-tetramer (blue circles and ordinate axes) fractions (based on their respective absorbance peaks) as a function of (C) salt (i.e., MgCl2) and (D) DNA concentrations. The dashed lines connecting the points in panel C are for visual aid only, while the curves in panel D were obtained by fitting the data. Each spectrum was acquired at room temperature. Reproduced with permission from ref. 374 Copyright 2017 American Chemical Society.

Fig. 41