. 2023 Oct 24;52(22):7848–7948. doi: 10.1039/d0cs00936a

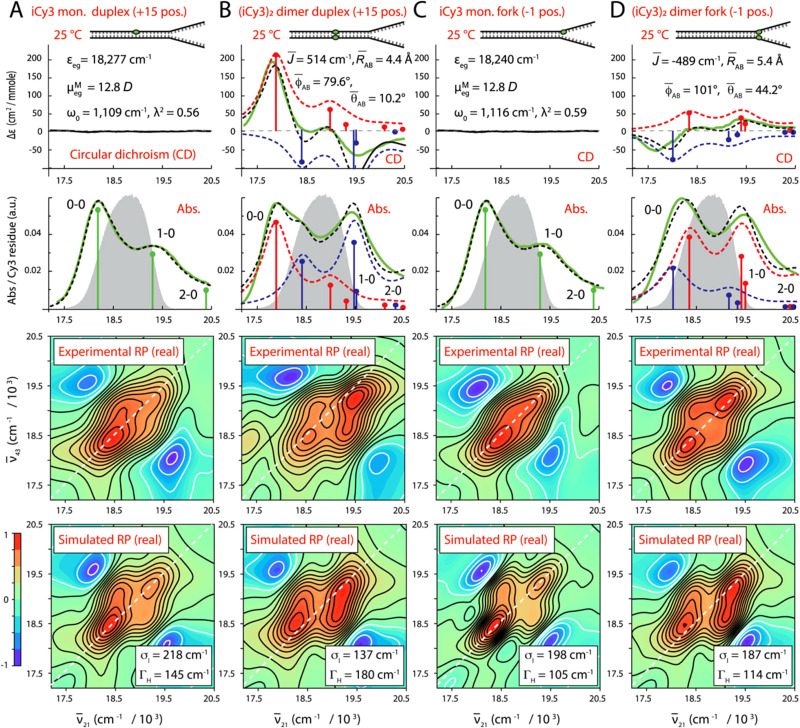
Fig. 60. Temperature-dependent conformations of cyanine dimer labeled ss–ds DNA junctions. Experimental and simulated spectroscopic measurements performed at room temperature for (iCy3)2 dimer ss–dsDNA constructs as a function of probe labeling position. (A) iCy3 monomer +15 ss-dsDNA construct, (B) (iCy3)2 dimer +15 ss–dsDNA construct, (C) iCy3 monomer −1 ss–dsDNA construct, and (D) (iCy3)2 dimer −1 ss-dsDNA construct. The experimental CD (top row) and absorbance spectra (second row) are shown (in green) overlaid with vibronic spectral features (black dashed curves) obtained from optimized fits to the Holstein–Frenkel model. The symmetric (+) and anti-symmetric (−) excitons are shown in blue and red, respectively. Values of the optimized parameters are shown in the insets of the corresponding panels. The laser spectrum (in gray) is shown overlaid with the absorbance spectrum. Experimental rephasing spectra (third row) are compared to the optimized simulated rephasing spectra (fourth row). Reproduced with permission from ref. 410 Copyright 2022, the Royal Society of Chemistry.

Fig. 60