. 2023 Oct 24;52(22):7848–7948. doi: 10.1039/d0cs00936a

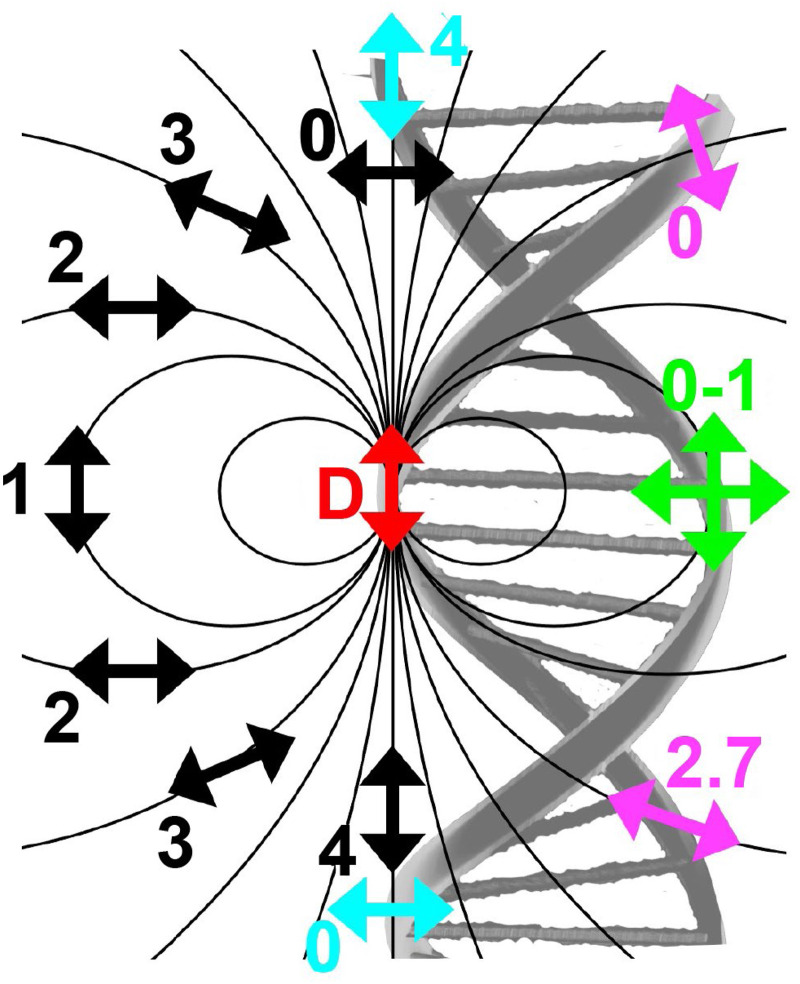
Fig. 7. Schematic representation of relative orientations of transition dipole moments of D emission (D-red double-headed arrow) and A absorption. The left side (black double-headed arrows) represents orientation in free space. The right side (colored double-headed arrows) represents attachment of D and As to DNA (orientations were chosen randomly to show values between 0 and 4). Same colors represent same D–A distances. Green arrows represent random orientation. The value of κ2 (numbers next to the A arrows) depends on the angle between the transition moment of A and the electric field of D at the location of A (ω) and the angle between the transition moment of D and the line connecting the centers of D and A (θ). κ2 = (1 + 3 cos2 θ) cos2 ω.

Fig. 7