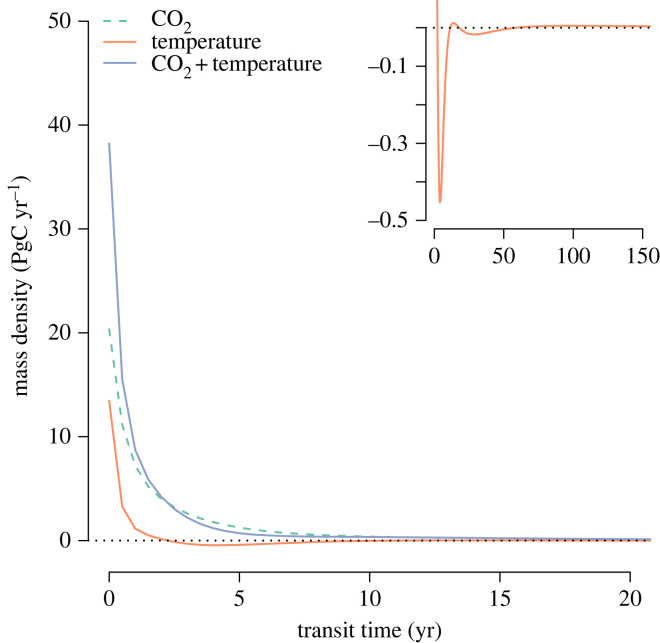
Figure 3.
Differences between backward transit time distributions of the different simulations at year 2020 with respect to the equilibrium transit time distribution of the model of Emanuel et al. [30]. The inset on the upper right shows the results from the simulations of temperature change only at a different scale to highlight the differences in respiration at different ranges of transit times. Axes in the inset correspond to the same variables and units as the main figure with only differences in scale.

