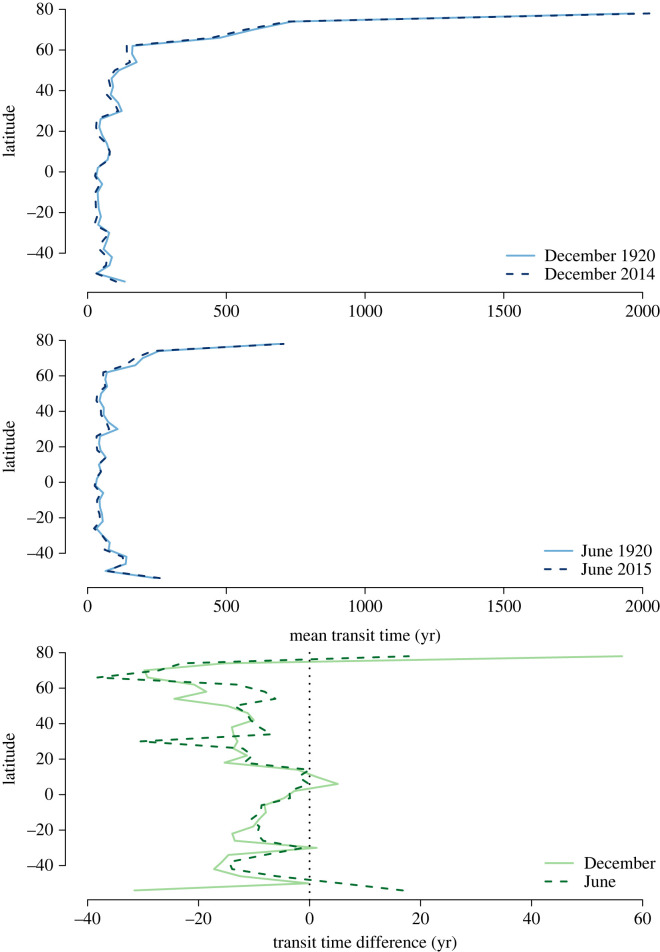
Figure 9.
Latitudinal distribution of the mean backward transit time for NH winter and summer months in 1920 and 2014/2015. The upper panel represents the latitudinal average across all ensemble members for winter, and the middle panel for summer. The lower panels represents the difference in mean backward transit times between 1920 and 2014/2015.

