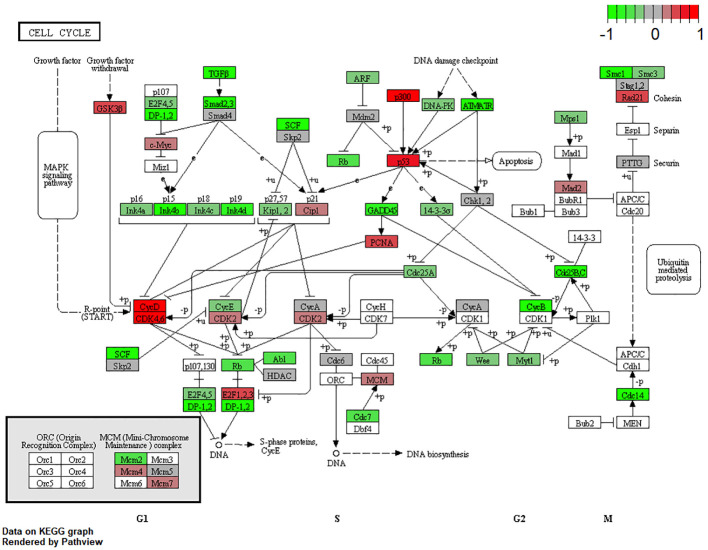
Figure 7.
Expression of different pathways involved in the cell-cycle signaling pathway. Pathways marked in red were overexpressed (1), and green pathways were downregulated (−1) when comparing URBs with DRBs. URBs showed an upregulation of P300, P53, CyD, CDK4,6, and E2F1,2,3 when compared with DRBs. DRBs showed an upregulation of TGF-β and SMADs2,3, together with their downstream ligands P15 and P19.

