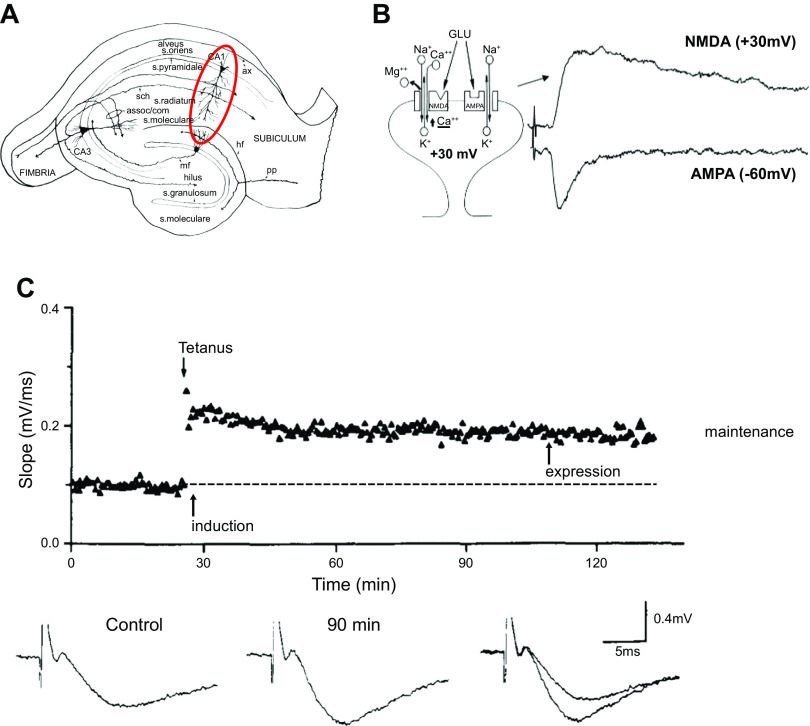
Figure 1.
A diagram of the hippocampal slice and example of long-term potentiation (LTP). A: diagram of the hippocampal slice preparation. The red circle highlights the CA1 region where most studies on LTP have been carried out. B: diagram of an excitatory spine synapse onto a dendritic spine. Synapses contain α-amino-3-hydroxy-5-methyl-4-isoxazolepropionic acid (AMPAR) and N-methyl-d-aspartate (NMDAR) receptors. Glutamate (GLU) binds to both receptors, but at resting potentials (−60 mV) only the AMPAR is activated, because the NMDAR channel is blocked by extracellular Mg2+. Depolarizing the cell (+30 mV) unblocks the NMDAR. C: an example of LTP. Field potential responses (aggregate extracellular responses reflecting the simultaneous activation of a large number of excitatory synapses) are shown at bottom. After a 25-min baseline of responses evoked by 0.1-Hz stimulation, a 1-s, 100-Hz tetanus is delivered and then 0.1-Hz stimulation is resumed for the rest of the experiment. The response is measured as the slope rather than the peak to avoid voltage-dependent responses that can contaminate the measurement. The response to 0.1-Hz stimulation following the tetanus is clearly elevated, as shown by the superimposed traces on right. Modified from Ref. 38, with permission from Neuron.

