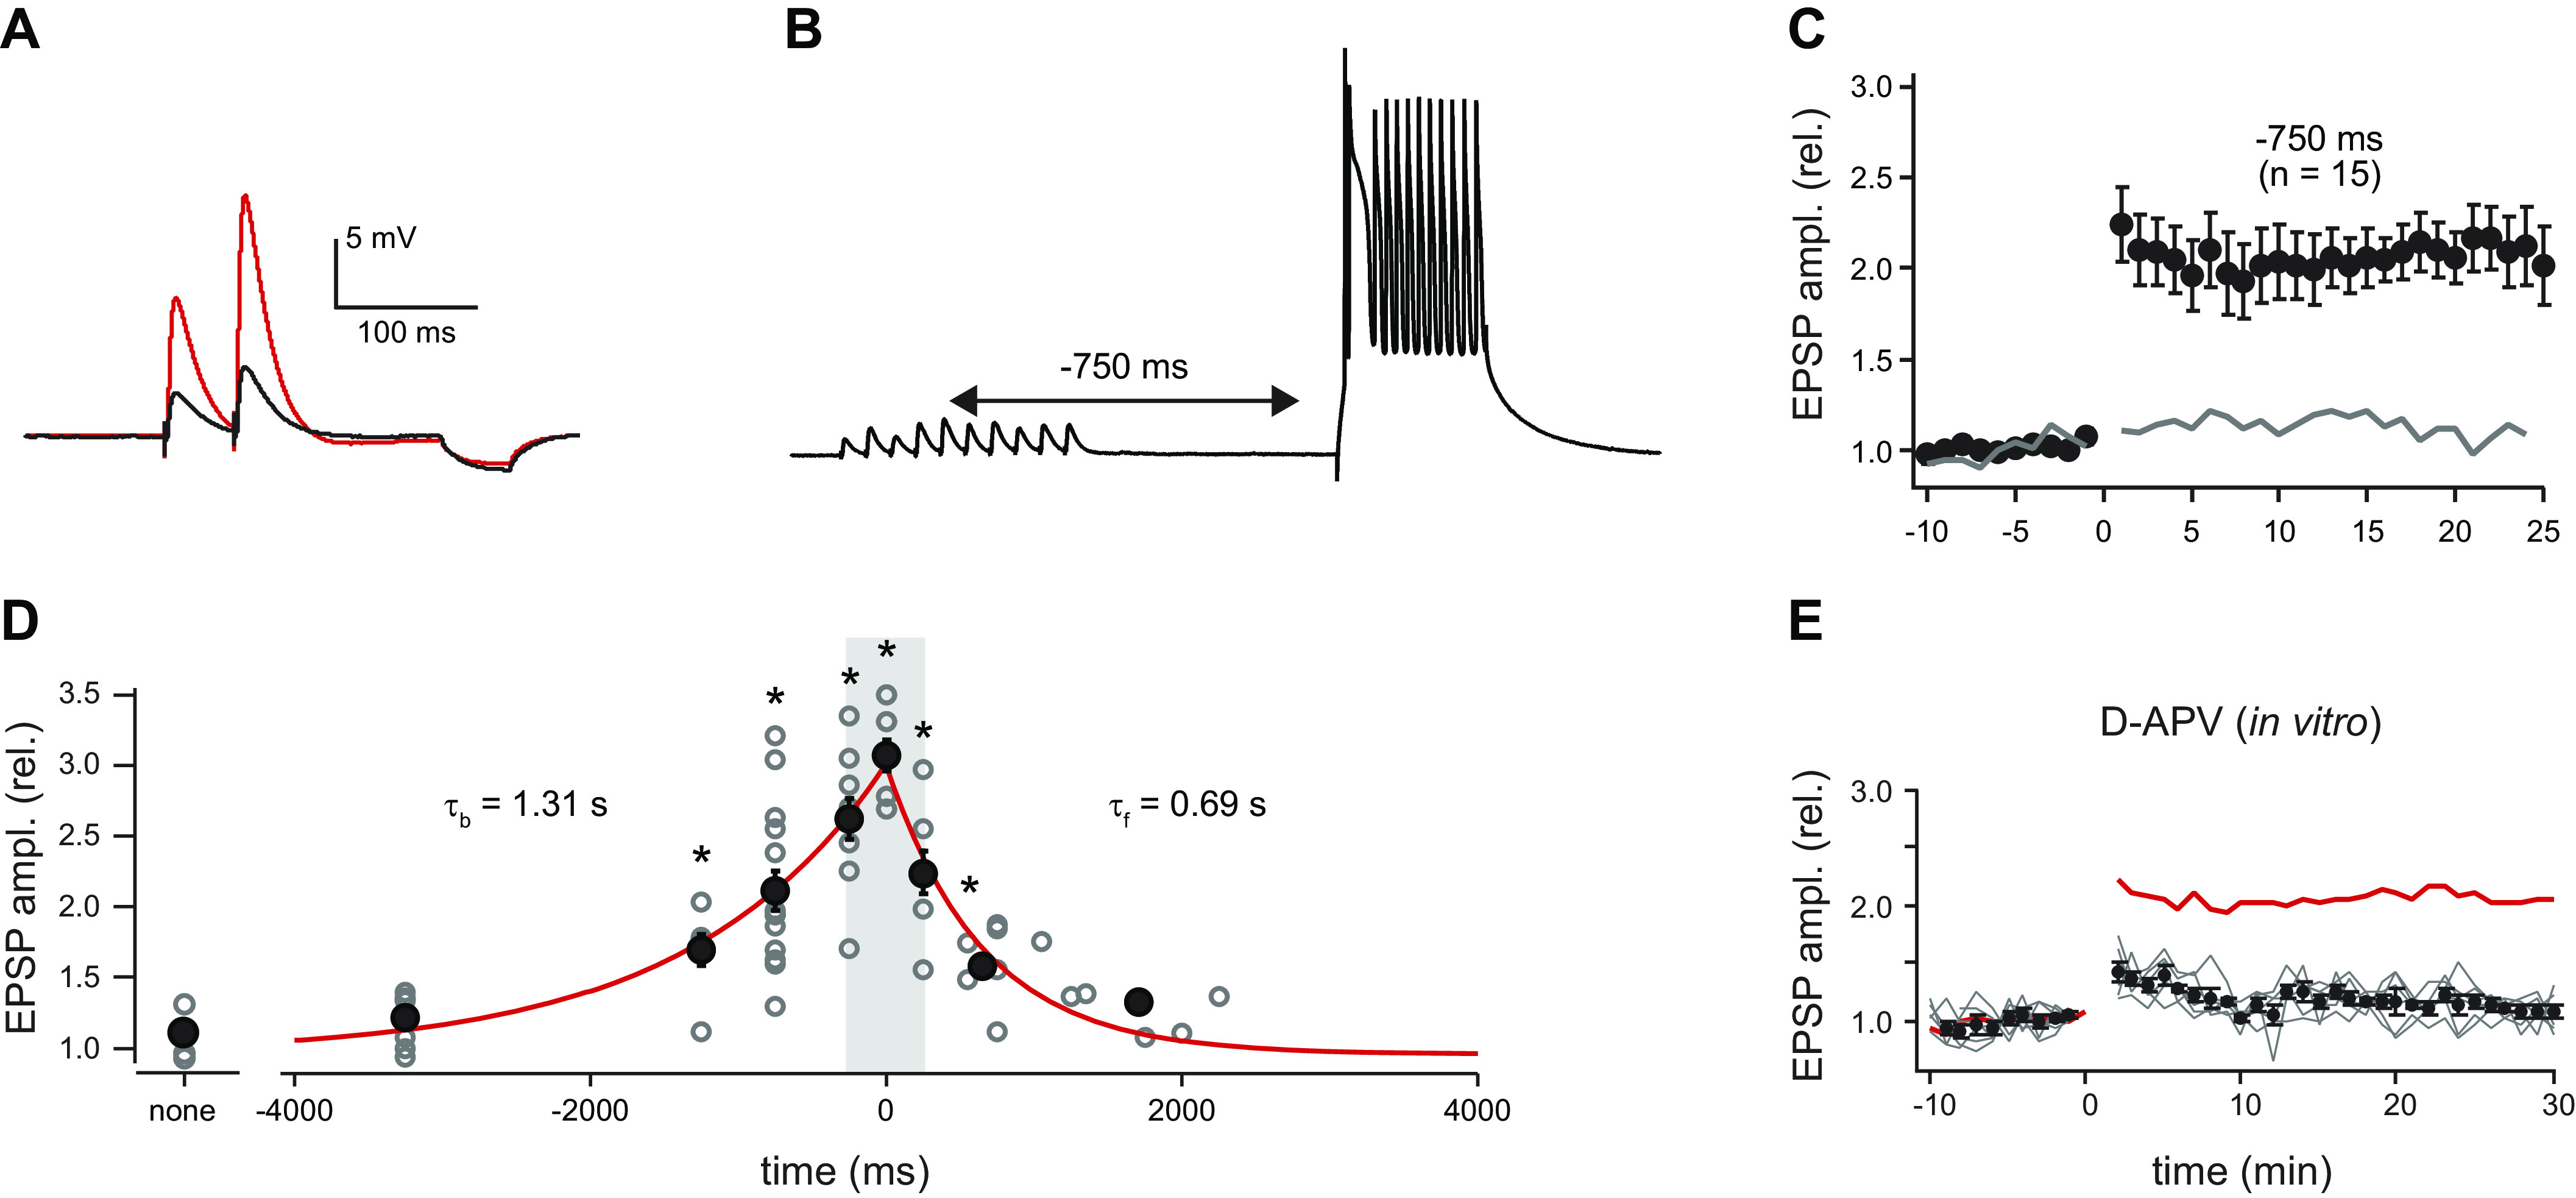
Figure 12.

Behavioral timescale synaptic plasticity. A: excitatory postsynaptic potentials (EPSPs) used to determine synaptic strength (50-ms interval). Black trace is average baseline EPSP; red trace is average postpairing EPSP. Hyperpolarization following EPSPs from 50-ms, –25-pA current injection used to determine input resistance (Rin). B: membrane potential (Vm) trace showing representative induction protocol with 10 synaptic stimuli (20 Hz) followed by plateau potential (300-ms current injection). C: average EPSP amplitude (normalized to baseline; ±SE) for population of neurons that received the indicated induction protocol. Induction (5 pairings) at 0 min. Gray line is average EPSP amplitude for synaptic stimulation alone. rel., Relative. D: plot of postinduction EPSP amplitude normalized to baseline vs. the induction interval time for the entire population of neurons. Open gray symbols are individual neurons; black symbols are means. Tau backward (tb) from exponential fit of data ranging from 0 to –3,250 ms (red line projecting to negative times). Tau forward (tf) from exponential fit of data ranging from 0 to +2,000 ms (red line projecting to positive times). Synaptic stimulation alone (no pairing interval, “none”) not included in exponential fits. See supplementary methods in Ref. 104 for means and P values. E: effect of 20 µM d-2-amino-5-phosphonopentanoic acid (d-APV; left). Average EPSP amplitude (normalized to baseline; ±SE) for population of neurons that received –750-ms interval induction protocol. Red line is mean for control (from C). Gray lines are individual neurons. Modified from Ref. 104., with permission from Science.
