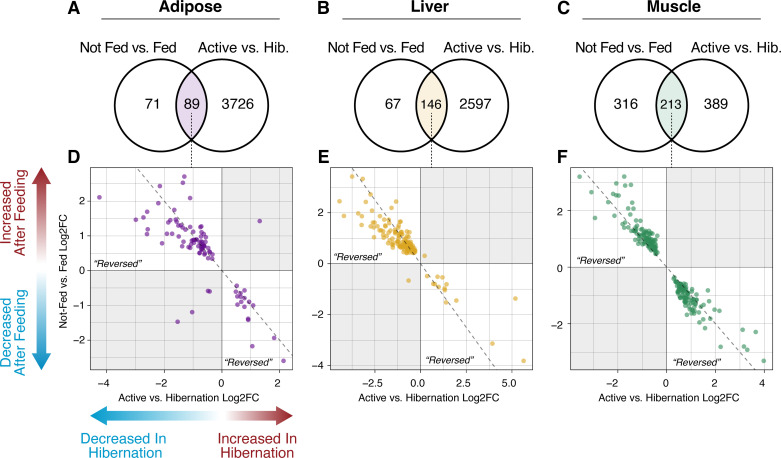
Figure 1.
Reversal of hibernation-specific gene expression following feeding. Venn diagrams indicate overlapping differentially expressed (DE; determined using DEseq2; IHW P value < 0.05) genes after midhibernation feeding (left) and between active and hibernation seasons (right) in adipose (A), liver (B), and muscle tissue (C). The number of replicates (n) per treatment is provided in Table 1. Dot plots of log2-fold change values for overlapping DE genes in adipose (D), liver (E), and muscle (F). Positive values on the x-axis indicate increased expression during hibernation relative to the active season, whereas positive values on the y-axis indicate increased expression following feeding. The top-left and bottom-right quadrants correspond to genes with “reversed” expression following feeding (i.e., downregulation during hibernation and subsequent upregulation after feeding).

