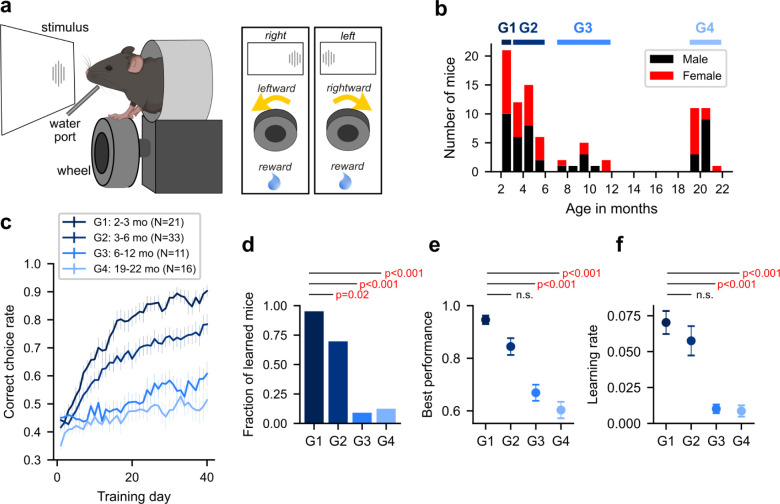
Figure 1. Learning-dependent decision making declines with age.
a. Decision-making task. (left) international brain laboratory task set-up. (right) decision-making rule related to stimulus, choice, and outcome.
b. Distribution of age and sex across trained mice. The thick horizontal bars above the histogram indicate the age interval included in each of 4 age groups.
c. Learning curves from 4 age groups. X-axis represents training day (1 session / day), and y-axis the correct choice rate. Mean ± S.E.
d. The fraction of learned mice in each group.
e. The best performance across all training days. Mean ± S.E.
f. The learning rate. Mean ± S.E.

