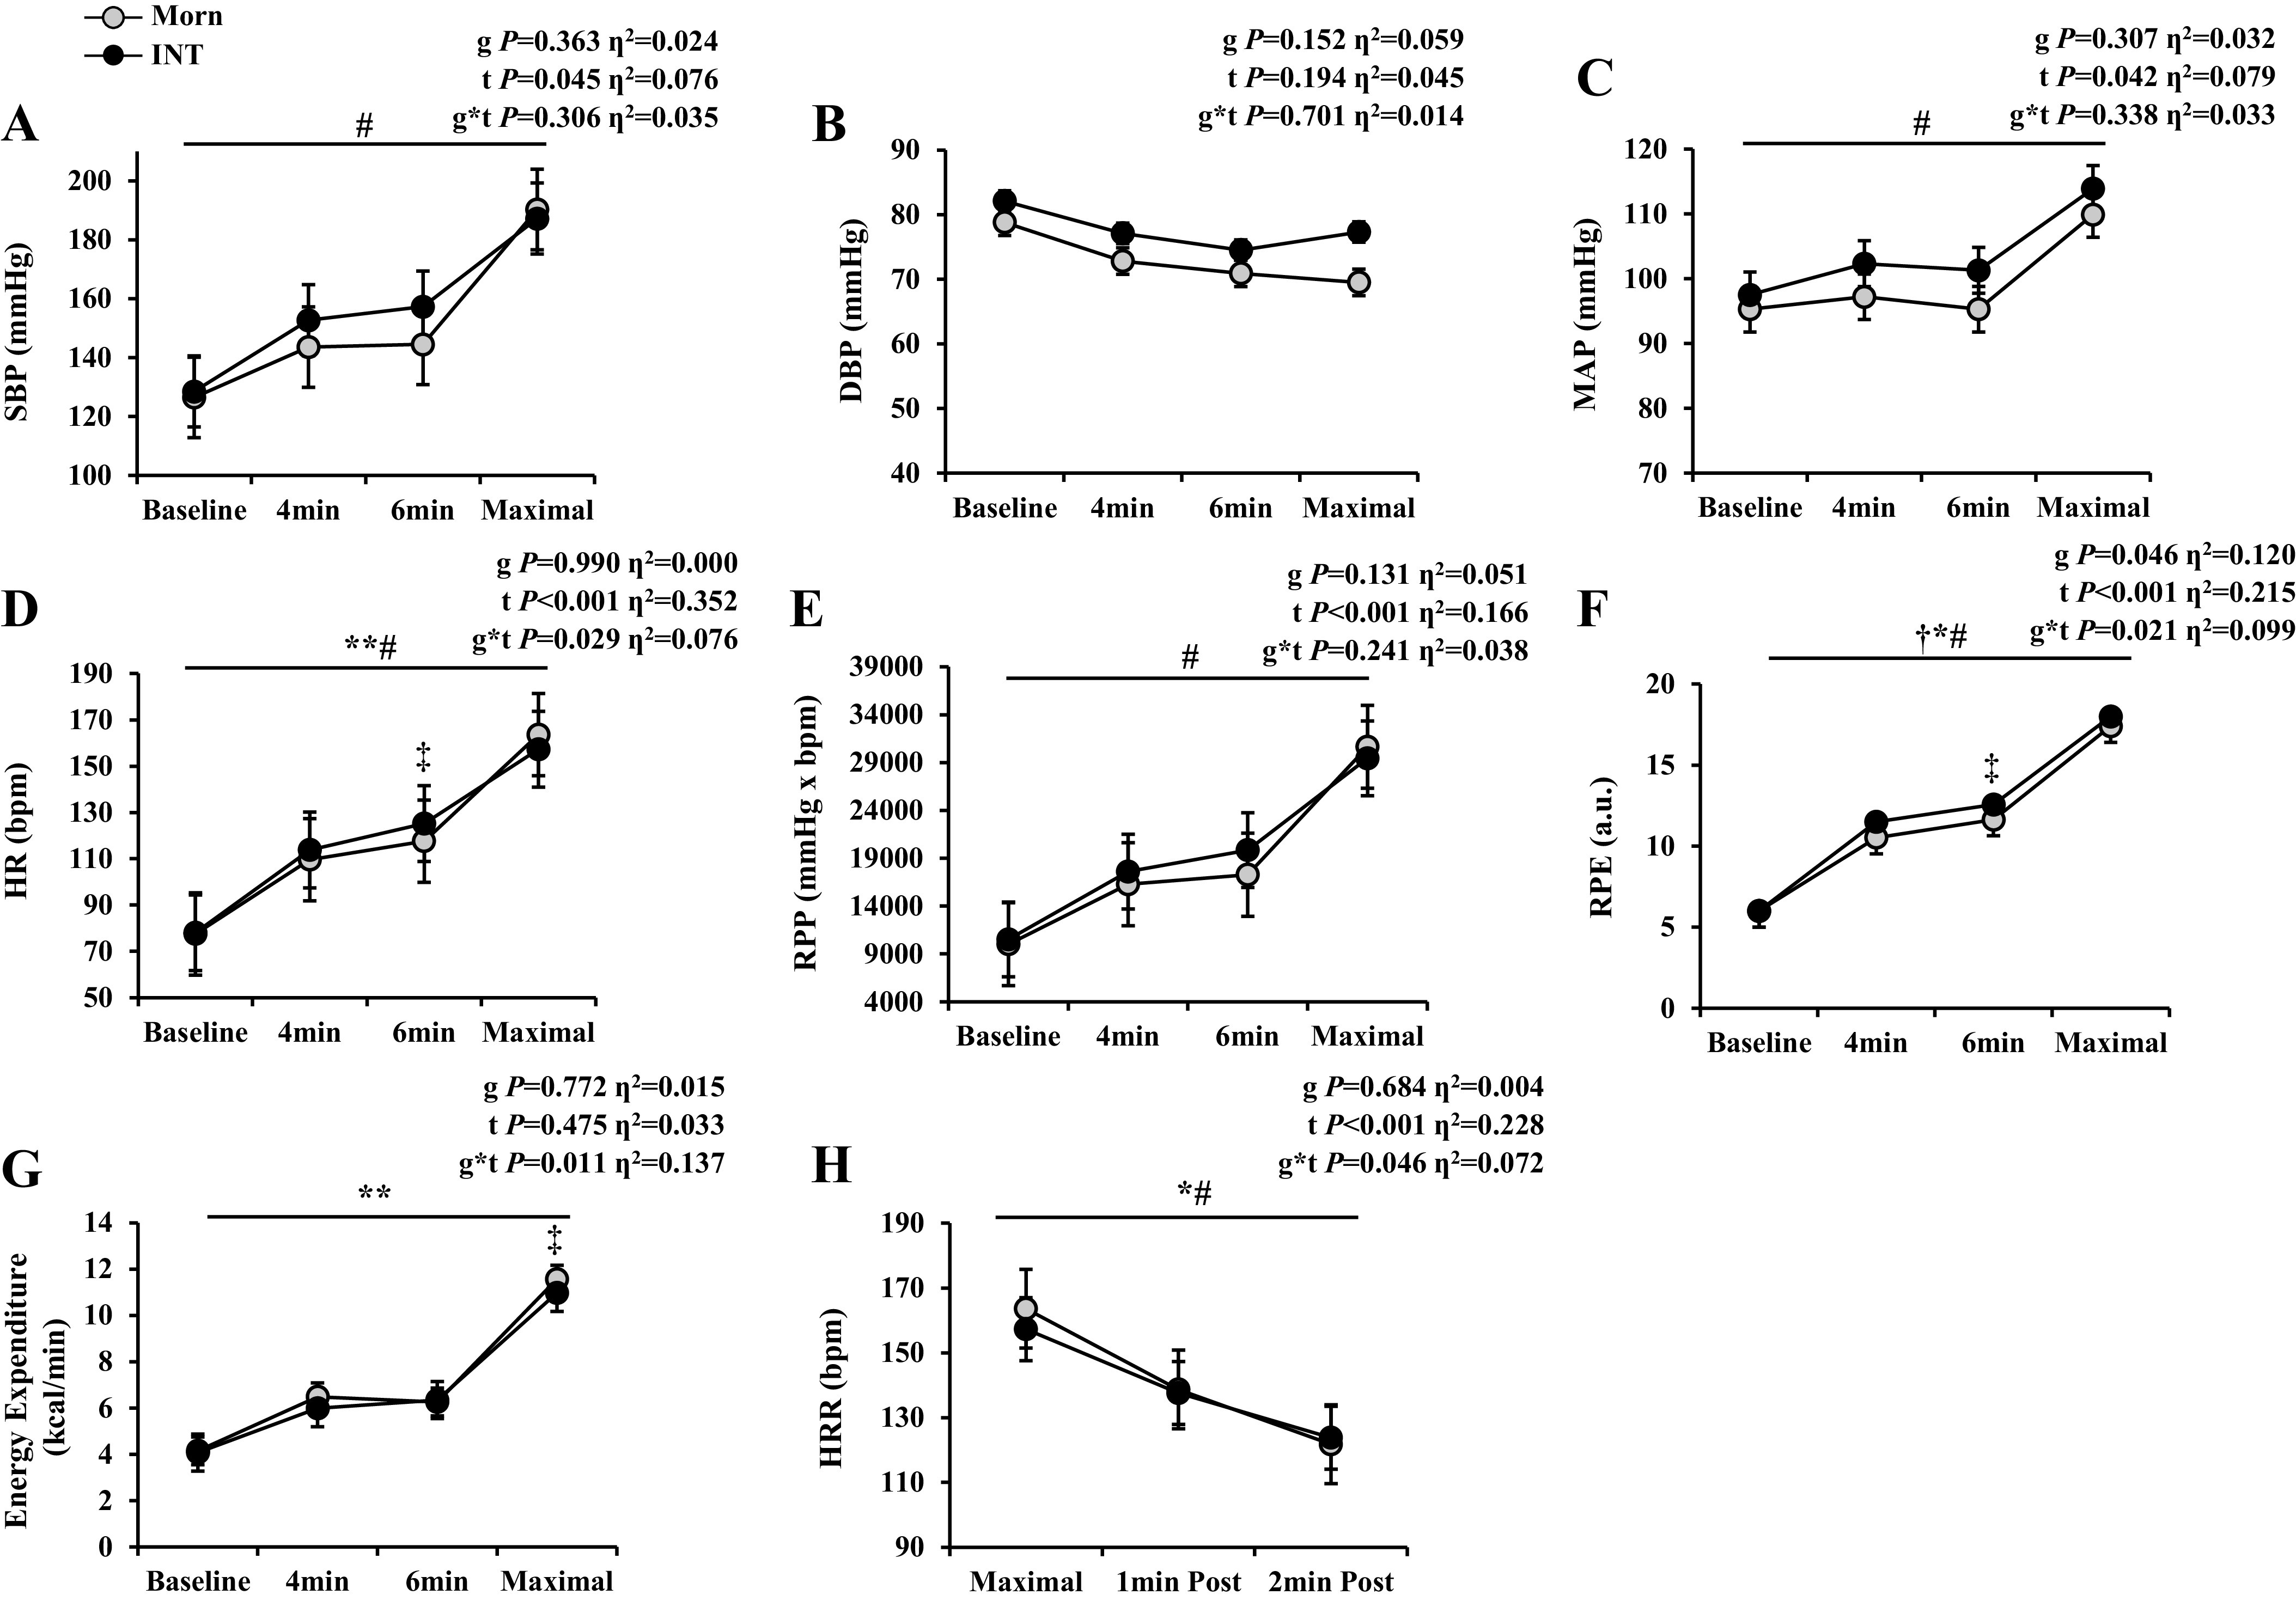
Figure 2.

Exercise hemodynamics. Data are represented as means ± SE. Two-way (group × time) ANCOVAs were used to determine the effect of graded exercise testing with fitness as a covariate. A–G: exercise hemodynamics at baseline, minutes 4 and 6, and maximal exertion: systolic blood pressure (SBP; A), diastolic blood pressure (DBP; B), mean arterial pressure (MAP; C), heart rate (HR; D), rate pressure product (RPP; E), rate of perceived exertion via BORG scale (RPE; F), and energy expenditure (G). Sample size and sex distribution between groups for all exercise hemodynamic data include the following: Morn, n = 23 (18 females); Int, n = 23 (19 females). H: heart rate recovery (HRR) after maximal exercise testing and 1 and 2 min postexercise: Morn, n = 22 (18 females); Int, n = 22 (18 females). Significance denoted represents results after covarying for V̇o2max. †P ≤ 0.05, significant group effect. #P ≤ 0.05, significant time effect. *P ≤ 0.05 or **P ≤ 0.01, significant group × time effect. ‡P ≤ 0.05, post hoc analysis. Effect size was calculated via partial η2.
