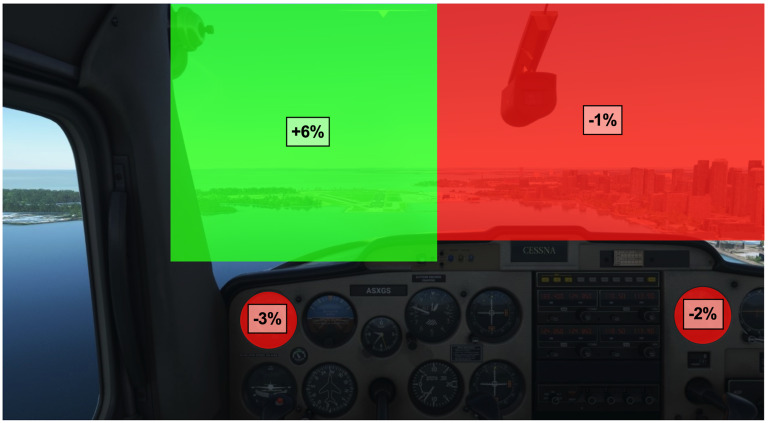
Figure 4.
Illustration of the visual stimuli employed during landing and the corresponding change in dwell time (%) between easy and difficult conditions. Only significant changes in dwell time are displayed over their corresponding area of interest (AOI) (i.e., airspeed, power, runway, and horizon AOIs). Group mean differences (difficult-easy) are illustrated in red to indicate a decrease in AOI dwell time and green to indicate an increase in AOI dwell time.

