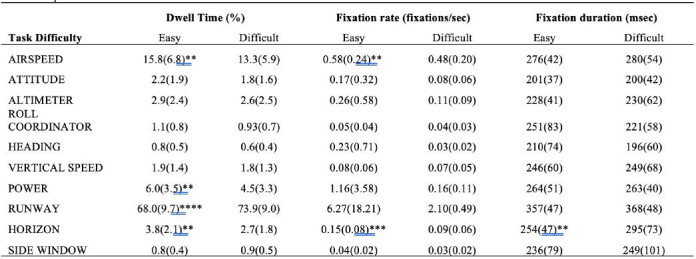
Table 1.
Traditional gaze values calculated for all areas of interest during easy and difficult conditions.

Note. Mean (standard deviation) values for all traditional gaze measures across all areas of interest (AOI) and task conditions (easy versus difficult). Significant changes between task difficulties and their corresponding dependent variable and AOI reported via *p 0.05, **p 0.01, ***p 0.001, ****p 0.0001.
