

Abstract
Super-resolution microscopy can transform our understanding of nanoparticle-cell interactions. Here, we established a super-resolution imaging technology to visualize nanoparticle distributions inside mammalian cells. The cells were exposed to metallic nanoparticles and then embedded within different swellable hydrogels to enable quantitative three-dimensional (3D) imaging approaching electron microscopy-like resolution using a standard light microscope. By exploiting the nanoparticles’ light scattering properties, we demonstrated quantitative label-free imaging of intracellular nanoparticles with ultrastructural context. We confirmed the compatibility of two expansion microscopy protocols, protein retention and pan-expansion microscopy, with nanoparticle uptake studies. We validated relative differences between nanoparticle cellular accumulation for various surface modifications using mass spectrometry and determined the intracellular nanoparticle spatial distribution in 3D for entire single cells. This super-resolution imaging platform technology may be broadly used to understand the nanoparticle intracellular fate in fundamental and applied studies to potentially inform the engineering of safer and more effective nanomedicines.
Keywords: Nanoparticles, super-resolution, expansion microscopy, 3D imaging, label-free, nanomedicine
Graphical Abstract

Introduction
Developing safer and more effective nanomedicines requires imaging tools and methods to quantify nanoparticle spatiotemporal distributions at cellular, sub-cellular, and ultrastructural levels.1 These quantitative data have the potential to guide nanoparticle engineering with the goal of controlling nanoparticle interactions with cells.2,3
Conventional biological transmission electron microscopy (TEM) can achieve a spatial resolution of ~2 nm to provide ultrastructural information of cell and tissue sections.4 However, the imaging depth in TEM is typically limited to very thin biological samples. With section thicknesses of ~100 nm or less, it is difficult to achieve 3D imaging of entire cells or tissues with TEM, as the exact stacking of images from different sections is challenging.5,6 On the other hand, capturing the full 3D volume of biological samples using standard optical microscopes is relatively straightforward.7–12 Unfortunately, the spatial resolution in standard optical imaging is diffraction-limited to ~200–250 nm.13 This resolution limitation presents a major challenge to the imaging of nanoparticles in their ultrastructural context within cells and tissues. Optical imaging methods capable of overcoming the aforementioned diffraction limit are termed super-resolution imaging methods.14 One such method is expansion microscopy, a hydrogel-based 3D super-resolution imaging technique in which samples are physically expanded 4 to 20-fold. This expansion process leads to reported spatial resolutions of nearly 10 nm, which provides valuable ultrastructural information.15,16
An additional challenge in optical microscopy of nanoparticles is the need for detection agents, often attached as fluorescent labels to the nanoparticle surface.17 These modifications may alter the nanoparticle surface chemistry and physiochemical properties, affecting how the nanoparticles interact with cells.18–21 Therefore, a label-free nanoparticle imaging method is desirable that provides information about the 3D intracellular nanoparticle distribution with ultrastructural resolution.22
In this study, we explored and established the combination of expansion microscopy protocols with scattered light imaging of label-free metallic nanoparticles to quantify intracellular nanoparticle distributions. Scattered light imaging involves the illumination of metallic nanoparticles and subsequent light detection at the same wavelength as the illumination light.23 Expansion microscopy relies on anchoring proteins in biological samples to a swellable poly(acrylamide-co-sodium acrylate) based hydrogel.15,24 The subsequent water absorption expands the protein-hydrogel hybrid samples by a linear factor of approximately 4X isotropically, resulting in an equivalent substantial increase in the achievable spatial resolution of standard light microscopes. Recent expansion microscopy protocols enable expansion factors up to 10X for single expansions and up to 20X for iterative expansions.16,25–27 Expansion microscopy protocols have demonstrated utility for various applications, including the computational diagnosis in early breast lesions,28 studying cell-material interfaces,29 and visualizing the anatomical structures of whole zebrafish larvae.30 We combined different expansion microscopy protocols with label-free scattered light imaging of intracellular metallic nanoparticles, as shown in Figure 1.
Figure 1. Overview of the combination of expansion microscopy and scattered light imaging of label-free nanoparticles.
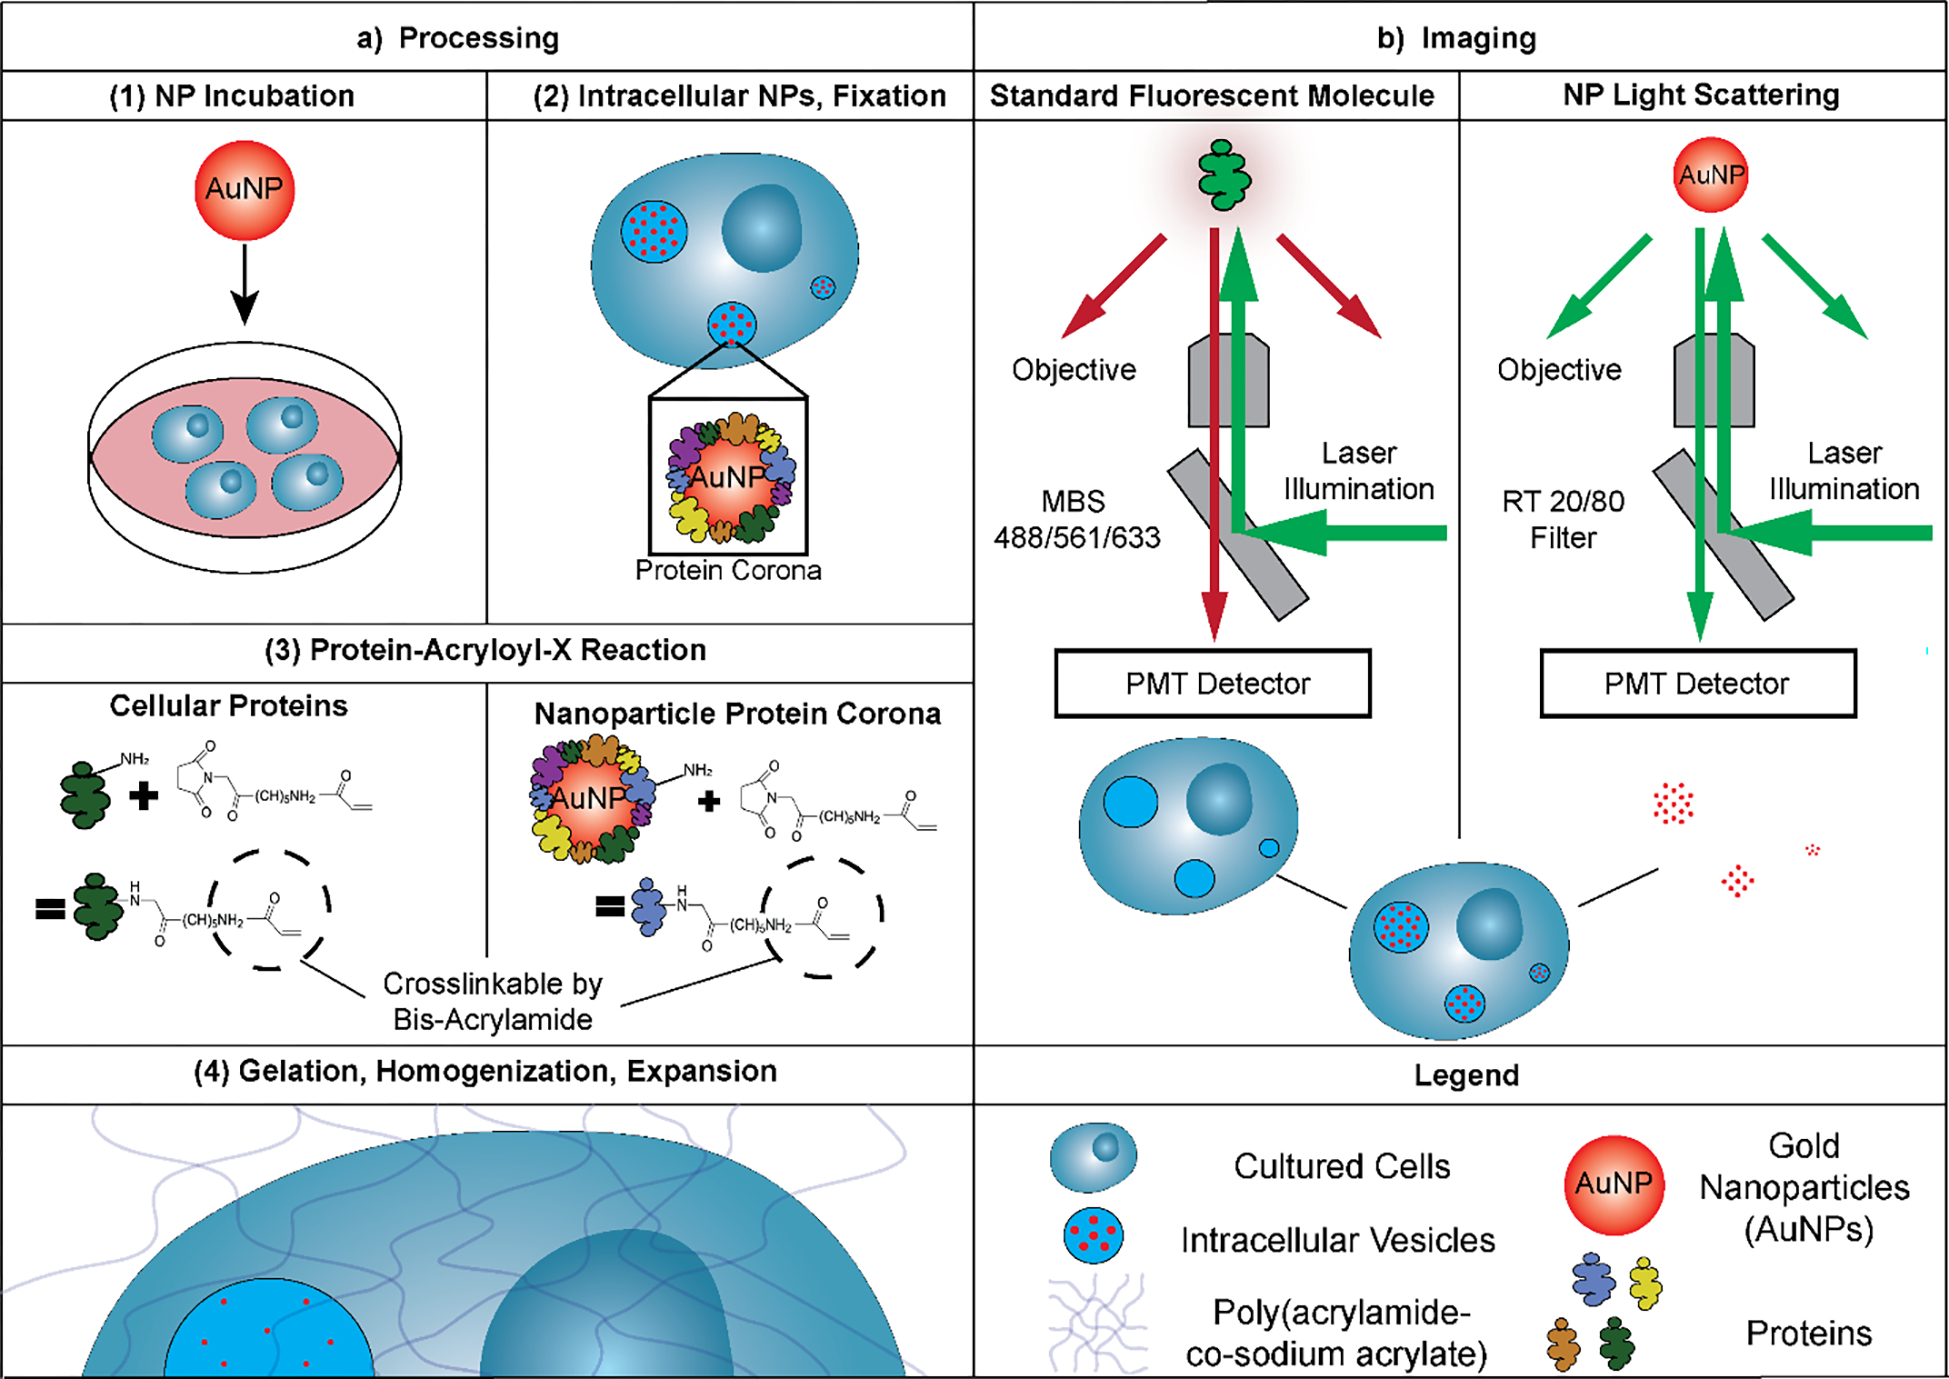
(a) We first treated cultured cells with gold nanoparticles (AuNPs). Following fixation with paraformaldehyde, we processed the cells through protein retention expansion microscopy (proExM). In proExM, the proteome of the cells is treated with Acryloyl-X, SE, a molecule that binds to primary amines in proteins, which then gets incorporated into a swellable gel matrix. The protein corona adsorbed onto the surface of intracellular AuNPs, is also incorporated into the gel matrix by the Acryloyl-X, SE treatment. We then homogenized the samples with Proteinase K before swelling them in ultrapure H2O. While the AuNPs do not physically expand along with the anchored intracellular protein, they remain in their initial relative positions within the cells. (b) We accomplished label-free nanoparticle imaging by exploiting the efficient light scattering properties of inorganic nanoparticles. We used a narrow light detection window around the illumination laser wavelength (+/− 5 nm) to collect the scattered light, while effectively rejecting the emission light from standard fluorophores. This imaging method allows the nanoparticle light scattering signal to be overlayed with the fluorescence signal from stained expanded cells to allow for the localization of nanoparticles within individual vesicles.
Results and Discussion
Achieving super-resolution imaging with expansion microscopy
The diffraction limit of visible light microscopy presents a barrier to the ultrastructural imaging and analysis of intracellular nanoparticles. This challenge is illustrated in Figure 2a, showing a diffraction-limited confocal laser scanning microscopy (CLSM) image of cultured murine triple-negative breast cancer epithelial (4T1) cells. Since most intracellular features are smaller in size than the optical diffraction limit,31 super-resolution microscopy is needed to resolve nanoparticle distributions with ultrastructural context and accuracy.
Figure 2: Expansion microscopy of 4T1 mammary tumor mouse cells.

(a) Non-expanded 4T1 cells labeled with the DNA stain, 4′,6-diamidino-2-phenylindole (DAPI) (blue) for nuclei visualization and the glycoprotein stain, wheat germ agglutinin WGA-CF488A (green) for cell membrane visualization. (b) Expanded 4T1 cells stained with DAPI and WGA-CF488A. (c) Quantitative analysis of the nuclei area in μm2 of non-expanded and expanded cells, measured on ImageJ. The mean values (solid black line) were used to calculate the linear expansion factor of 4.1X (n=90) using Equation 1. An unpaired one-tailed t-test resulted in a statistically significant difference in the means of the nuclei areas between the two groups (****p<0.0001). (d) Non-expanded cells bulk (pan) stained with NHS-AF555 to visualize the entire proteome of the cell (left) and a digital magnification of the cell in the red box by a factor of 4.1X (right). (e) Expanded cells pan-stained with NHS-AF555, demonstrating a clear increase in image resolution and contrast compared to the digital magnification image. The scale bars indicate 20 μm for the unmagnified images and 5 μm for the magnified image. Scale bars for images of expanded cells are the original length as obtained by the microscope (i.e. not corrected for expansion factors).
To address this need, we adopted the protein retention expansion microscopy (proExM) protocol, a protease-based variant of the original expansion microscopy protocol where cellular proteins are anchored directly to a swellable gel matrix.24,32 Using this protocol, we achieved a ~4X linear expansion of cultured cells resulting in super-resolved images. Figures 2b, S1 show 4T1 cells processed with the proExM protocol. In Figure 2c, we determined a linear expansion factor of 4.1X. We then further quantified the increase in image resolution in Figure S2a. We found that line profiles across non-expanded nuclei had 1.3 +/− 0.1 pixel intensity peaks/μm, whereas expanded nuclei had 5.4 +/− 0.1 pixel intensity peaks/μm (following correction for expansion factors, see Methods section) (n=3).
Imaging intracellular features through bulk staining
Next, we adopted a bulk (pan) staining protocol to fluorescently label most of the cell’s proteome.16 This staining increased the overall imaging contrast and is based on an N-Hydroxysuccinimide (NHS) ester-activated fluorescent dye (NHS-AF555) that binds covalently to available primary amine groups. Figure 2d demonstrates non-expanded 4T1 cells stained with NHS-AF555 and a 4.1X digital magnification to compare against expanded cells stained with NHS-AF555 in Figure 2e. These images illustrate that the expanded cells were visually less blurry than the digitally magnified cell image, which supports that the proteome’s bulk (pan) staining helps resolve the local protein densities to reveal the cellular nanoarchitecture by standard light microscopy.16 We quantified this observation with line profiles in the same manner as mentioned above and found that the non-expanded NHS-AF555 stained cells had 0.9 +/− 0.1 pixel intensity peaks/μm, whereas expanded NHS-AF555 cells had 4.6 +/− 0.1 pixel intensity peaks/μm (Figure S2b) (n=3).
The pan-staining approach further enables the imaging of intracellular compartments and vesicles of various sizes. Since intracellular vesicles are primarily fluid-filled compartments, they provide contrast against the other protein-rich and fluorescently stained areas throughout the cytoplasm.33 In Figure 2e, intracellular vesicles are seen as dark areas within the cytoplasm. A decrease in pixel intensity of nearly 99% from the highest value occurs based on the line profile analysis. Using a combination of pan-staining and proExM, we spatially resolved more individual intracellular vesicles than with pan-staining alone (Figures 2d and 2e).
Label-free nanoparticle imaging in cells through light scattering
We then confirmed the feasibility of label-free nanoparticle imaging within cells using 55-nm gold nanoparticles (AuNPs) as a model nanoparticle system. Label-free imaging enables studying interactions between nanoparticles and cells of interest without adding fluorophores to the nanoparticles. This label-free approach is desirable because fluorophore labeling can change the nanoparticle surface chemistry and physicochemical properties resulting in differing cellular interactions.18–21 We selected quasi-spherical 55-nm AuNPs because the size-dependent uptake of AuNPs into mammalian epithelial cells peaks at around 50 nm in diameter.34,35 Furthermore, this nanoparticle size limits the potential for size restrictions on uptake since most intracellular vesicles of interest for nanoparticle uptake are larger than 60 nm.31
We accomplished label-free nanoparticle imaging by exploiting the efficient light scattering properties of inorganic nanoparticles.23 We used a narrow light detection window around the illumination laser wavelength (typically +/− 5–10 nm) to collect the scattered light. (Figure 1b) This approach further helps to efficiently reject any potential stray emission light from fluorophores, which is an elegant way of adding another imaging channel to the CLSM system to exclusively image the nanoparticles.10
Next, we synthesized citrate-coated 55-nm AuNPs based on previously reported methods.36–38 We characterized the AuNPs with dynamic light scattering (DLS) (Table S1) to quantify nanoparticle size and polydispersity, determined the zeta potential (Table S2), and used UV-Vis spectrophotometry (Figure S3a) to estimate the nanoparticle molar concentrations. Furthermore, we also characterized the AuNPs with transmission electron microscopy (TEM) (Figure S4a–b). We then coated the AuNPs with 10-kDa methoxy-terminated poly(ethylene glycol)-orthopyridyl disulfide (mPEG-OPSS) polymers for increased colloidal stability. The successful conjugation of PEG polymers to the AuNPs surface was confirmed by DLS measurements that showed an increase in the hydrodynamic diameter by ~35.9 +/− 0.7 nm for PEG-AuNPs compared to citrate-coated AuNPs, with the expected zeta potential being near neutral39 (Table S1, S2) (n=3). The observed hydrodynamic diameter size increase aligns with our previous work involving similar successful conjugations.39,40 We further confirmed the surface conjugation of mPEG-OPSS to the AuNPs qualitatively with TEM through negative staining with uranyl acetate, resulting in a visible halo around the AuNPs (Figure S4c).
Next, we incubated 4T1 cells with 200-pM PEG-AuNPs for 24 hours. We then washed, fixed, and stained the cells with either DAPI and a glycoprotein stain, wheat germ agglutinin (WGA-CF488A), or NHS-AF555 alone. While cell membranes and other biological features can also scatter light, the light scattering efficiencies of these biological materials are orders of magnitude lower than that of metallic nanoparticles.10 We used cells without nanoparticle treatment as a threshold baseline to remove the light scattering background signal. Figure 3a shows the light scattering signal obtained from intracellular AuNPs using CLSM following the thresholding method. We then demonstrated that the nanoparticle light scattering imaging did not interfere with the emission of fluorophores that were excited using the same laser wavelength. Using the NHS-AF555 dye and a laser illumination wavelength of 561 nm, we show in Figure 3b that nanoparticle light scattering imaging is compatible with the NHS-AF555 pan staining. No visible signal from the NHS-AF555 dye is detected in the nanoparticle light scattering imaging channel following thresholding to remove the background light. Our approach allows the label-free detection of intracellular nanoparticles and is fully compatible with conventional fluorescence staining and imaging.
Figure 3: Label-free imaging of nanoparticles in non-expanded 4T1 cells via light scattering imaging.

4T1 cells were incubated with 55-nm PEG-AuNPs for 24 h before being washed, fixed, and stained. The overlay of the stained cells and light scattering (red) are shown first, followed by a magnification of all the channels, and then only the light scattering channel for cells with or without PEG-AuNPs shown in grayscale. Images were thresholded against parallel controls not incubated with AuNPs to remove the light scattering background signal. (a) Cells stained with DAPI (blue) and WGA-CF488A (green). (b) Cells stained with NHS-AF555 (gray). The scale bars indicate 50 μm for the unmagnified images and 15 μm for the magnified images. The nanoparticle light scattering signal intensity from the PEG-AuNPs was measured on ImageJ by the integrated density of the light scattering signal in regions of interest drawn around the membrane of the cells stained with (c) DAPI and WGA-CF488A or (d) NHS-AF555. An unpaired one-tailed t-test resulted in a significant statistical difference in the means of the two groups (****p<0.0001) (n=9). (e) Inductively coupled plasma mass spectrometry (ICP-MS) measurements of 4T1 cells with or without PEG-AuNP incubation to quantify gold nanoparticle cell uptake. Unpaired one-tailed t-test (****p<0.0001) (n=4). Bars indicate mean +/− standard deviation (SD).
We then quantified the signal intensity of the nanoparticle light scattering channel as a measurement of relative intracellular AuNP content. Figures 3c and 3d demonstrate the ImageJ software-based quantification of the nanoparticle light scattering intensity of individual cells stained with DAPI and WGA-CF488A or NHS-AF555, respectively. In both cases, there was a statistically significant difference (****p<0.0001) in the light scattering intensity measured from the cells treated with PEG-AuNPs compared to those not treated. Furthermore, the measured signal intensity of the cells not treated with PEG-AuNPs was close to the expected background signal.
We then validated that the nanoparticle light scattering signal can be acquired at various wavelengths using multiple laser types. Figure S5 shows RAW 264.7 macrophages that were incubated with 55-nm AuNPs coated with 5-kDa methoxy-terminated poly(ethylene glycol)-thiol (mPEG-SH) (Table S1). The AuNPs within the same group of cells were visualized using four different laser lines: a 488-nm argon laser, a 561-nm diode-pumped solid-state laser, a 594-nm helium-neon laser, and a 633-nm helium-neon laser. Our results confirm that nanoparticle light scattering imaging is broadly attainable and independent of a specific laser wavelength. We observed in Figure S5 that the 561-nm laser provided the strongest nanoparticle light scattering signal, which was expected given that the 561-nm laser has the closest wavelength to the peak extinction wavelength of 55-nm AuNPs (Figure S3). Therefore, we continued to use this laser wavelength for all subsequent nanoparticle light scattering imaging.
Next, we validated that the detected imaging signal in the nanoparticle light scattering channel was indeed due to the presence of gold within the cells. We used inductively coupled plasma mass spectrometry (ICP-MS) as a quantitative elemental analysis method to determine the gold content of cells with and without PEG-AuNPs incubation.39,40 The ICP-MS results revealed a cellular gold content equivalent to ~290 +/− 13 PEG-AuNPs/cell for 4T1 cell samples incubated with PEG-AuNPs, while the non-treated control cells exhibited a gold content that was close to the background (Figure 3e) (n=4).
To further validate that the nanoparticle light scattering signal was due to intracellular AuNPs, we treated 4T1 cells that were incubated with PEG-AuNPs with a gold etching solution consisting of KI and I2.41 Given that the cells were permeabilized with 0.1% (V/V) Triton X-100 following fixation, the KI/I2 etchant dissolved both intracellular and extracellular AuNPs. We imaged the same group of cells before and after the gold etchant treatment (Figure S6a–b). Qualitatively, the images confirm that the nanoparticle light scattering signal visibly disappears after the etching. We then quantified the corresponding decrease in nanoparticle light scattering signal intensities in these cells. Figure S6c demonstrates that the nanoparticle light scattering signal was reduced to near background levels following etching. This result further confirms that intact AuNPs are needed to produce an efficient nanoparticle light scattering signal.
Nanoparticle light scattering signal is not affected by photobleaching
We then confirmed one of the major advantages of the nanoparticle light scattering imaging method, which is the signal’s imperviousness to photobleaching. Photobleaching is a common challenge in fluorescence imaging that involves the irreversible degradation of organic fluorophores due to repetitive excitation and emission cycles, i.e. repeated or continuous laser exposure.42 In contrast, nanoparticle light scattering imaging takes advantage of the inherent scattering properties of metallic nanoparticles. This property is not altered by laser exposure. Therefore, the nanoparticle light scattering signal does not photobleach.
To demonstrate this advantage, we first synthesized fluorescently tagged 55-nm AuNPs. We selected the organic fluorophore cyanine 5 (Cy5) for its commonly reported use in nanoparticle labeling.9,43–45 Using DLS, we measured an increase in the average hydrodynamic diameter of these nanoparticles compared to citrate-coated AuNPs by 44.3 +/− 3.0 nm, confirming the successful preparation of Cy5-PEG-AuNPs (Table S1) (n=3). To verify the functionality of the Cy5 fluorophore on the nanoparticle surface, we ran an agarose gel electrophoresis experiment to visualize the variations in migration distances compared to different groups as well as their corresponding fluorescence emissions through a 0.5% agarose gel (Figure S7a). We then further validated the functionality of the Cy5 fluorophore on the nanoparticle surface by measuring the fluorescence emission spectra of Cy5-AuNPs, PEG-AuNPs, and Cy5-PEG using a spectrofluorometer. The results demonstrated highly similar fluorescence emission spectra from the Cy5-AuNPs and the Cy5-PEG with minimal detected emission from the PEG-AuNPs (Figure S7b).
We then incubated 4T1 cells with Cy5-PEG AuNPs for 24 hours. Figure S8a shows the same group of cells imaged over a 30-minute timelapse at an imaging rate of 1 image/minute. Here, the Cy5 fluorescence signal noticeably decreased in intensity throughout the timelapse, while the nanoparticle light scattering signal did not. We quantified these results by measuring the signal intensities of both channels in individual cells across the timelapse with ImageJ. Figure S8b demonstrates a clear imperviousness of light scattering signals to photobleaching, while the Cy5 fluorescence intensity dropped by over 50% throughout the timelapse.
The imperviousness of nanoparticle light scattering imaging to photobleaching is particularly advantageous for expansion microscopy, given that large Z-stacks with many sections are required for the 3D imaging of expanded cells. Depending on the cell thickness and step size determined by the optical section thickness,7,46 an average non-expanded eukaryotic cell may take around 10–20 Z-steps to image at a high objective. Following an isotropic 4X expansion, 40–80 Z-steps would be needed to image an expanded cell at the same step size. The repeated exposure to the laser excitation light can cause the emission of typical fluorophores bound to the surface of nanoparticles to photobleach throughout the Z-stack acquisition. This sequential data acquisition process inherently results in signal intensities toward the top of the cell being significantly weaker than the ones detected near the bottom of the cell. Such differences in signal intensities from nanoparticles throughout a single image stack would make quantitative signal intensity analysis unreliable, demonstrating an additional advantage of nanoparticle light scattering imaging for expansion microscopy.
Combining expansion microscopy with nanoparticle light scattering imaging
Next, we asked whether we could combine fluorescent labeling of cells with label-free scattered light imaging of nanoparticles to determine cell uptake and intracellular nanoparticle distributions. We observed that the nanoparticles could be visualized in their original relative positions within cells after the hydrogel expansion. This observation is likely due to the nanoparticle protein corona being crosslinked into the polyacrylamide-based gel matrix introduced during the proExM procedure. During this process, the cellular proteome is covalently attached to the gel matrix via Acryloyl-X, SE, a small molecule that binds to primary amines in proteins. The labeled proteins are crosslinked similarly into the gel matrix as the acrylamide monomers.32
We can use this behavior to crosslink proteins on the nanoparticle surface within the polyacrylamide-based gel. Nanoparticles form a protein corona upon encountering biological fluids. This corona represents a protein shell that spontaneously forms around the nanoparticle surface.47,48 The corona proteins will crosslink into the polyacrylamide gel matrix during the Acryloyl-X, SE treatment, allowing the nanoparticles to become crosslinked and retained within these hydrogels. We confirmed the presence of surface proteins isolated from nanoparticle surfaces upon fetal bovine serum (FBS) incubation qualitatively with sodium dodecyl sulfate-polyacrylamide gel electrophoresis (SDS-PAGE). We used FBS as a model protein source since we performed the cell culture and nanoparticle incubation experiments using FBS. Figure S9 demonstrates the visible protein bands on the lanes of citrate-coated AuNP and PEG-AuNP upon FBS incubation. In contrast, no visible protein bands appeared on the lanes of either AuNP type without FBS incubation.
We then investigated whether the combination of expansion microscopy and nanoparticle light scattering imaging would allow for the in-depth analysis of nanoparticle accumulation within individual intracellular vesicles. Figure 4a shows expanded 4T1 cells incubated with PEG-AuNPs, stained with NHS-AF55. The intracellular vesicles are visible in expanded cells stained with NHS-AF555 as dark areas, with nanoparticles now visible within these intracellular compartments.
Figure 4: Expansion microscopy is compatible with nanoparticle light scattering imaging.

(a) Expanded 4T1 cells with or without PEG-AuNPs stained with NHS-AF555 (gray). The overlay of the stained cells and light scattering (red) are shown first, followed by a magnification of both channels, and then only the light scattering channel for cells with or without AuNPs shown in grayscale. (b) ImageJ-based quantitative analysis of the nuclei area in μm2 of non-expanded- and expanded cells both with and without AuNPs (n=90). Black lines represent means. A two-way ANOVA with Šidák’s multiple comparison test did not show statistical significance (p=0.99 for both groups). The scale bars indicate 50 μm in the unmagnified images and 15 μm in the magnified images, not corrected for expansion factors.
We then asked whether the presence of AuNPs in a cell sample would affect the proExM expansion factor. Figure 4b shows no statistically significant difference (p=0.84) in the mean nuclei cross-sectional area of 4T1 cells containing AuNPs compared to controls for both non-expanded and expanded cells. A linear expansion factor of ~4.0X for cells containing AuNPs was determined, compared to a linear expansion factor of ~4.1X in controls. These results demonstrate the quantification of nanoparticle light scattering signals within individual vesicles in 3D.
We then explored the use of fluorescent endocytosis tracers with proExM and nanoparticle light scattering imaging. To identify the vesicle types that the AuNPs accumulated in, we attempted a super-resolution colocalization analysis of the nanoparticle light scattering signal of AuNPs co-incubated with specific fluorescent endocytosis tracers. Here, we selected tetramethylrhodamine-conjugated transferrin (TRITC-transferrin), a marker for clathrin-mediated endocytosis, as transferrin can be retained within cells following protein fixation.49,50 In Figure S10, we show 4T1 cells co-incubated with PEG-AuNPs and 25 μg/mL TRITC-transferrin. Since we demonstrated that fluorescence staining and nanoparticle light scattering imaging are compatible with expansion microscopy, the super-resolution colocalization analysis for the TRITC and nanoparticle signals would be possible. However, we observed a significant decrease in the fluorescent signal from the TRITC-transferrin following proExM. This decrease is likely due to the volumetric expansion resulting in the separation or loss of fluorophores, limiting our capabilities to do accurate colocalization analysis. To potentially address this issue in future work, perhaps a fluorescent secondary antibody targeting against transferrin could be employed to improve the signal intensity.51
We next explored the different cell lines, nanomaterials, and surface conjugations to demonstrate the generalizability of our method. Previous work determined that coating the surface of 55-nm AuNPs with the polysaccharide heparosan (HEP-AuNPs) (Table S1, S2, Figure S3a, S4d) results in high nanoparticle uptake within DC 2.4 dendritic cells.40 We used these dendritic cells and incubated the cells with HEP-AuNPs to demonstrate our method’s generalizability across a different cell type and nanoparticle surface modification (Figure S11). We further demonstrated in Figure S12 the generalizability using a different nanomaterial, i.e. 60-nm streptavidin-coated silver nanoparticles (60-nm Strep-AgNPs) (Table S1, S2, Figure S3b, S4e) in RAW 264.7 macrophages. For consistency with other experiments, the 561-nm laser was used for the AgNPs light scattering imaging.
We then explored the ability to visualize smaller nanoparticle sizes. It has been shown that the nanoparticle light scattering imaging method is feasible for nanoparticle diameters down to ~20 nm in diameter.23 Figure S13a shows RAW 264.7 macrophages after incubation with 40-nm streptavidin-coated AgNPs (Table S1, S2, Figure S3b, S4f), demonstrating the expected nanoparticle light scattering signal. However, as shown in Figure S13b, the nanoparticle light scattering signal is no longer visible in these cells following the proExM expansion process. We hypothesized that the surface-adsorbed proteins on the 40-nm Strep-AgNPs were not sufficiently crosslinking into the polyacrylamide-based gel matrix to hold the nanoparticles in place, resulting in a loss of nanoparticles during sample expansion. We found that this limitation can be overcome by increasing the crosslinker density of the gel matrix. By doubling the N,N′-methylenebisacrylamide crosslinker concentration in the gelation solution, we could better retain and visualize 40-nm Strep-AgNPs within expanded cells (Figure S13c). However, this workaround came at the cost of a decrease in expansion factor by >25% (i.e. ‘tighter’ gel structures do not expand as much).52
We further assessed if a percentage of intracellular 55-nm AuNPs was lost during the proExM process. We approached this question qualitatively by imaging the same group of cells before and after the proExM process, as shown in Figure S14a. Here, we observed a similar amount of nanoparticle light scattering signal in the cells before and after expansion. However, we could not quantitatively compare the nanoparticle light scattering signal between the two groups since a higher laser power was required to visualize intracellular AuNPs within expanded cells than non-expanded cells.
To address this challenge, we quantified the gold content of each residual solution from the proExM process through ICP-MS to determine intracellular gold content loss. Figure S14b shows that there was no significant difference (p>0.99) in the detected gold content of residual solutions from samples that were treated with AuNPs compared to untreated controls (see Methods section). These data suggest that the standard proExM process does not result in an appreciable loss of intracellular 55-nm AuNPs.
We then wondered whether the AuNP retention in cells throughout the proExM process resulted from intracellular AuNP aggregation, given that we have already established a size correlation to AuNP leakage in Figures S12 and S13. To address this question, we incubated HEP- and PEG-AuNPs in culture media (DMEM), complete culture media (DMEM +10% FBS + 1% penicillin-streptomycin (P/S)), or an artificial lysosomal fluid53 for 3 hours before comparing their colloidal stability to AuNPs incubated in ultrapure H2O using single-particle inductively coupled plasma mass spectrometry (SP-ICP-MS). SP-ICP-MS allows us to quantify the mass of individual AuNPs at single-particle resolutions to estimate their approximate sizes. The SP-ICP-MS method then allows us to determine the corresponding colloidal stability of the AuNPs as aggregates would be registered as single AuNPs of significantly larger masses (i.e. sizes) than colloidally stable AuNPs.38,54–56 Figure S15 demonstrates that there is no significant difference (p>0.9999) in the means of the distributions of HEP- or PEG-AuNPs, respectively, in any of the tested conditions compared to the ultrapure H2O control group. These results suggest that the AuNPs may not significantly aggregate intracellularly. These results further suggest that the AuNP light scattering signals we acquired were not significantly affected by aggregated AuNPs.
Super-resolution 3D imaging of nanoparticle intracellular localization
While expansion factors of ~4X allow the visualization of nanoparticles within relatively large intracellular compartments in 3D, higher expansion factors are needed to resolve smaller vesicles. To achieve such higher resolutions, we adopted the pan-ExM protocol16. Pan-ExM uses a protease-free, iterative hydrogel expansion process that results in a linear expansion factor between ~13–20X, corresponding to a lateral resolution of ~10–20 nm. This protocol enables the resolution of many intracellular features, such as individual mitochondria. The visualizations of these intracellular features through pan-ExM have been validated by Bewersdorf et al., who compared the expansion-corrected measured distances between internal cristae of mitochondria in expanded HeLa cells to previously published reports from STED images of live HeLa cells.16,57 Figure 5 (a–b) shows non-expanded RAW 264.7 macrophages with and without intracellular HEP-AuNPs, respectively. In Figure 5 (c, d), we show the 3D reconstructions of CLSM Z-stacks of RAW 264.7 with and without HEP-AuNPs treatment after pan-ExM, along with two individual slices from the stacks (Movies S1, S2). We show that the nanoparticle light scattering signals were localized within intracellular vesicles throughout multiple Z positions in the HEP-AuNP group with no visible signal in the control group. This result confirms the compatibility of pan-ExM with label-free nanoparticle light scattering imaging, while demonstrating that the achievable resolution through this method is sufficient for qualitatively analyzing intracellular nanoparticle distributions. We then validated the visualization of intracellular vesicles through bulk (pan) staining to verify that these were not artifacts from the expansion processes. Figure S16a shows non-expanded RAW 264.7 macrophages with and without HEP-AuNPs imaged with standard CLSM settings. Here, we see some dark areas within the cytoplasm that exhibit nanoparticle light scattering signals, however, there is insufficient resolution to fully localize the nanoparticle light scattering signals within the vesicles. Therefore, in Figure S16b, we then imaged the same samples with the Zeiss Airyscan detector, which allows for an increase in spatial resolution by up to 1.7X, as well as a 4–8X increase in the signal-to-noise ratio (SNR).58 Here, we can much more clearly visualize the intracellular vesicles as dark area within the cytoplasm of RAW 264.7 macrophages treated with HEP-AuNPs, and better localize the nanoparticle light scattering signals within them. These observations, along with the observation that there are relatively very few dark areas visible in the cytoplasm of cells that were not treated with AuNPs, suggest that the intracellular vesicle visualizations were not artifacts from the expansion processes.
Figure 5: Pan-ExM enables the 3D super-resolution imaging of cultured cells with high levels of specific AuNP localization.

Images of non-expanded RAW 264.7 macrophages stained with NHS-AF555 (grey) with- (a) or without (b) HEP-AuNPs, with the AuNP light scattering signal shown in red. Post pan-ExM images of cells (c, d) with 3D reconstructions of CLSM Z-stacks. Images (i) and (ii) depict individual x,y-slices. Digital magnifications of the regions of interest are shown, first with the overlay of both channels. Then the nanoparticle light scattering signal alone is shown in grayscale focused on individual vesicles revealing densely concentrated AuNPs (red) in cells. No noticeable light scattering signal in vesicles of cells that were not treated with AuNPs. The scale bars indicate 50 μm in the unmagnified images and 15 μm in the magnified images. Scale bars for images of expanded cells are the original length as taken by the microscope (i.e., not corrected for expansion factors).
Quantifying the effect of nanoparticle surface modifications on cell uptake and intracellular localization
To further investigate how nanoparticle surface modification affects nanoparticle-cell interactions and uptake, we compared 55-nm PEG-AuNPs to AuNPs coated with bovine serum albumin proteins (BSA-AuNPs) using 4T1 cells as a model system. Albumin is a known tracer for caveolae-mediated endocytosis. It is well established that decorating nanoparticles with albumin results in an increased uptake in cancer cells compared to PEGylated nanoparticles.59,60 We prepared BSA-AuNPs by incubating citrate-coated AuNPs in a 10 mg/mL BSA solution for 1 hour at 37°C. The successful BSA surface conjugation was confirmed by an increase in the nanoparticle hydrodynamic diameter by 26.2 +/− 2.2 nm, with an expected negative zeta potential61 (Table S1, S2, Figure S3a) (n=3). To further verify the formation of a BSA protein corona around the AuNPs, we ran an SDS-PAGE of isolated proteins from the nanoparticle surface (Figure S17). The isolated surface proteins appear as a band at about the same migration distance as the free BSA control. Figure S18 compares the uptake of these BSA- and PEG-AuNPs in 4T1 cells with and without pan-ExM treatment. Qualitatively, more BSA-AuNPs are visible within the cells compared to PEG-AuNPs after expansion, suggesting that this method can be used for comparing the uptake of nanoparticles with different surface modifications.
To demonstrate the utility of our super-resolution imaging method for comparing the uptake and distribution of nanoparticles with different surface modifications, we chose to compare the uptake of heparosan- (HEP) and PEG-AuNPs in RAW 264.7 macrophages following a 3-hour incubation.40 Figure S19(a–b) shows non-expanded cells upon incubation with HEP- or PEG-AuNPs, respectively. Qualitatively, there was an evident difference in nanoparticle light scattering signal between the two groups. This observation was confirmed quantitatively in Figure S19c with image analysis showing a significantly higher nanoparticle light scattering signal (****p<0.0001) being measured in non-expanded RAW 264.7 macrophages treated with HEP-AuNPs compared to PEG-AuNPs. Figure 6 (a–b) shows the RAW 264.7 macrophages incubated with either HEP- or PEG-AuNPs, respectively, after expansion with the pan-ExM protocol.
Figure 6: Pan-ExM enables quantitative comparisons of nanoparticle cell uptake.

RAW 264.7 cells were incubated with HEP-AuNPs (a) or PEG-AuNPs (b) for 3 hours before being washed, fixed, and expanded via pan-ExM, with 3D reconstructions of CLSM Z-stacks being shown along individual xy-slices, including digital magnifications focused on individual nanoparticle-containing vesicles. Digital magnifications of the regions of interest are shown, first with the overlay of both channels, and then the nanoparticle light scattering signal alone shown in grayscale. The scale bars indicate 50 μm in the unmagnified images and 15 μm in the magnified images, not corrected for expansion factors. TEM images of RAW 264.7 cells treated with HEP-AuNPs (c) or PEG-AuNPs (d) are shown, demonstrating similar AuNP (black spots) distribution patterns within a single imaging plane. The scale bars indicate 2 μm in the unmagnified images and 500 nm in the magnified images. (e) ICP-MS measurements of RAW 264.7 cells after incubation with HEP-AuNPs or PEG-AuNPs quantifying nanoparticle cellular uptake. Unpaired, one-tailed t-test (***p<0.001) (n=3). (f) Image analysis of the pan-ExM samples was done via MATLAB to quantify the nanoparticle light scattering signal to measure nanoparticle accumulation in both sample types across entire CLSM Z-stacks. Bars represent mean +/− SD, unpaired one-tailed t-test (****p<0.0001) (n=3). (g) The ratios HEP-AuNPs/PEG-AuNPs uptake in RAW 264.7 cells. Bars represent ratio +/− propagation of error, unpaired two-tailed t-test (ns = not significant, p=0.66). (h) The volumes of the cells and vesicles after pan-ExM across the entire CLSM Z-stacks. Unpaired one-tailed t-test (*p<0.05) (n=3). (i) Percentage of the total vesicle volume occupied by AuNPs. Bars represent mean +/− SD, unpaired one-tailed t-test (*p<0.05) (n=3).
We then compared our super-resolution imaging method against the traditional means of visualizing intracellular nanoparticle distribution and quantifying nanoparticle uptake. Since TEM has been the longstanding standard method for visualizing nanoparticle distribution within cells,62,63 we compared our pan-ExM-based images to TEM images of non-expanded RAW 264.7 cells with HEP- or PEG-AuNPs in Figure 6(c–d). As seen from these images, there is a similar distribution pattern of intracellular nanoparticles between the two methods, and the known preference of HEP-AuNPs over PEG-AuNPs in RAW 264.7 cells is readily observable.39,40 This finding suggests that pan-ExM combined with light scattering imaging enables the representative visualization of nanoparticle intracellular distributions. While TEM is restricted to the 2D imaging of thin (~70 nm) cell slices, we achieved robust and reliable 3D visualizations of nanoparticle distribution in entire cells.
To confirm that our method provides representative information about the number of nanoparticles in a cell, we first ran ICP-MS on non-expanded samples of RAW 264.7 macrophages treated with HEP- or PEG-AuNPs to determine the average number of nanoparticles per cell (Figure 6e). We then developed a MATLAB script to quantify the nanoparticle light scattering signals from pan-ExM samples to measure nanoparticle accumulation (Figure 6f). While the image analysis does not provide an exact count of the number of nanoparticles in the cells, given that it is currently unknown what the exact correlation between light scattering signals and nanoparticle numbers is, it does allow for relative comparisons across different nanoparticle conditions. As such, we compared the uptake ratio for HEP-AuNPs and PEG-AuNPs as measured by ICP-MS to our image analysis (Figure 6g). ICP-MS demonstrated that the cells took up 208+/− 72 (propagation of error) (n=3) times more HEP-AuNPs than they do for PEG-AuNPs, while the image analysis of the pan-ExM samples demonstrated that the ratio of HEP-AuNP uptake to PEG-AuNP uptake is 174 +/− 101 (n=3) with no significant difference (p=0.66) in this uptake ratio between the two methods. This analysis suggests that our method provides representative information about nanoparticle accumulation in entire cells. While ICP-MS is a destructive process that only provides information on the content of gold within a group of cells, our method reveals the spatial distribution within individual and intact single cells and can reveal cell-to-cell variability. Combined with the ability to visualize entire cells at super-resolution, we can now collect previously unobtainable spatial information about nanoparticle localization within intracellular vesicles throughout cells.
We further demonstrate the ability to determine the percentage of the cell volume occupied by intracellular vesicles. We used a MATLAB script to measure the area of the entire cell and the cumulative area of the vesicles on each Z-slice. The summations of the areas of each measurement through the Z-stack were then used to estimate their volumes (Figure 6h). We observed that the nanoparticle surface modifications affected not only nanoparticle uptake but also the frequency of intracellular vesicles that exist in response to nanoparticle incubation and endocytosis. The higher frequency of intracellular vesicles within RAW 264.7 macrophages treated with HEP-AuNPs compared to those treated with PEG-AuNPs may suggest that receptor-specific endocytic pathways significantly contribute toward the uptake of HEP-AuNPs. Yang et al. showed recently that heparosan polysaccharide-coated nanoparticles exhibit substantial endocytosis in innate immune cells to trigger the formation of more intracellular vesicles from additional endocytosis events compared to PEG-AuNPs.39,40
We then estimated the percentage of the vesicle volume occupied by nanoparticles (Figure 6i). Since the pixel area of the detected nanoparticle light scattering signal was significantly larger than the area a nanoparticle would realistically occupy in non-expanded cells, or potentially smaller in expanded cells (following correction for expansion factors), this estimation is not an exact measure. However, this estimate does allow relative comparisons between different nanoparticle surface modifications. We show that HEP-AuNPs occupied a significantly higher percentage of the vesicle volume than PEG-AuNPs (*p<0.05, Figure 6i), which is expected given the high endocytosis rates and efficiencies of HEP-AuNPs.39,40 We anticipate that this type of nanoparticle intracellular distribution analysis will be applied in future studies evaluating nanoparticle-cell interactions. Since the pan-ExM process is compatible with immunofluorescence labeling,16 more specific analyses of the nanoparticle distribution across different types of intracellular vesicles or other intracellular features and compartments could be accomplished in future studies.
Conclusions
We demonstrated that label-free metallic nanoparticles could be visualized in 3D within individual intracellular vesicles of cultured cells in a quantifiable manner through our super-resolution imaging method. Furthermore, we showed that this method provides comparable information to the standard methods of analyzing metallic nanoparticle intracellular distribution and uptake, TEM and ICP-MS, respectively, while also allowing for analyses that were not possible through either method. Our method provides visual 3D information on (a) intracellular nanoparticle distribution in their ultrastructural context, which is not readily obtainable through TEM, along with (b) quantifiable information of relative nanoparticle accumulation within individual intracellular vesicles, which is not obtainable through ICP-MS.
We presented two expansion protocols compatible with this method, proExM and pan-ExM. While proExM does not provide sufficient resolution to fully resolve most of the smaller intracellular features, it is a significantly faster protocol. Conversely, pan-ExM provides significantly higher resolutions for separating smaller, adjacent intracellular vesicles, albeit at the cost of significantly longer processing times. Furthermore, pan-ExM does not rely on proteases, allowing for the post-expansion antibody labeling of samples, which results in better epitope accessibility by molecular de-crowding. In contrast, only certain epitopes can survive the proteinase treatment used in proExM. However, certain variants of proExM have employed protease-free homogenization, similar to panExM.16,24,32 These factors may be considered when choosing which expansion microscopy protocol to use.
We anticipate our demonstrated super-resolution imaging protocols can be applied to research involving a variety of nanomedicine formulations to broadly improve the understanding of the intracellular nanoparticle fate. The successful application of this elegant method may empower more informed research into the nano-bio interactions of nanomedicine formulations toward better clinical results and the development of more efficacious therapies for various diseases.
Materials
Hydrochloric acid (HCl) (Sigma-Aldrich, 320331); Nitric acid (HNO3) (Sigma-Aldrich, 438073); Gold(III) chloride trihydrate (Sigma-Aldrich, 520918); Sodium citrate tribasic dihydrate (Sigma-Aldrich, S4641); Hydroquinone (Sigma-Aldrich, H9003); TWEEN® 20 (Sigma-Aldrich, P9416); mPEG-OPSS, MW 10,000 (Laysan Bio Inc., MPEG-OPSS-10K-1g); NH2-PEG-Thiol, MW 5,000 (Laysan Bio Inc., NH2-PEG-SH-5000-1g); Streptavidin - 60nm Silver Conjugate (SC-60-04-05, Cytodiagnostics); Streptavidin - 40nm Silver Conjugate (SC-40-04, Cytodiagnostics); Sodium tetrathionate dihydrate (Fisher Scientific, AC461920250); Cy5 NHS Ester (Click Chemistry Tools, 1076); NAP™−25 20 ST (Sigma-Aldrich, GE17-0852-01); 10X PBS Solution (Bio Basic, PD8117); 4T1, Mammary Tumor Mouse Cells (ATCC, CRL-2539); RAW 264.7 Mouse Macrophages (ATCC, TIB-71); DC 2.4 Mouse Dendritic Cells (Sigma Aldrich, SCC142M); DMEM, high glucose, pyruvate (Thermo Fisher, 11995065); RPMI-1640 Medium (ATCC, 30-2001); Fetal Bovine Serum (Thermo Fisher, 16000044); Penicillin Streptomycin (Thermo Fisher, 15-140-122); Trypsin-EDTA (Thermo Fisher, 25200072); Paraformaldehyde Solution (PFA), 4% in PBS (Thermo Fisher, J19943K2); Triton™ X-100 (Sigma-Aldrich, T8787); Bovine Serum Albumin (BSA) (Sigma-Aldrich, A7906); Transferrin From Human Serum, Tetramethylrhodamine Conjugate (TRITC transferrin) (Thermo Fisher, T2872); Wheat germ agglutinin (WGA), CF488A conjugate (Biotium, 29022-1); NucBlue™ Fixed Cell ReadyProbes™ Reagent (DAPI) (Thermo Fisher, R37606); Acryloyl-X, SE, 6-((acryloyl)amino)hexanoic Acid, Succinimidyl Ester (Thermo Fisher, A20770); Sodium Acrylate (Sigma-Aldrich, 408220); N,N′-Methylenebisacrylamide (Bis) (Sigma-Aldrich, M7279); Acrylamide Solution, 40% (Sigma-Aldrich, A4058); N,N′-(1,2-Dihydroxyethylene)bisacrylamide (DHEBA) (Sigma-Aldrich, 294381); Sodium Bicarbonate (Sigma-Aldrich, S6014); Sodium Hydroxide (Sigma-Aldrich, 221465); Sulfuric Acid (VWR, JT9681); Hydrogen Peroxide (Sigma-Aldrich, 216763); Gelatin from Bovine Skin Type B (Sigma-Aldrich, G9391); Paraformaldehyde 16% Solution, EM Grade (Electron Microscopy Sciences, 15710-S); Glutaraldehyde (Electron Microscopy Sciences, 16020); Sodium Borohydride (Sigma-Aldrich, 213462); Glycine (Sigma-Aldrich, 50046); Sodium Dodecyl Sulfate (SDS) (Fisher Scientific, AC230421000); Dimethyl Sulfoxide (DMSO) (Sigma-Aldrich, D2650); AF555Dye NHS Ester (Click Chemistry Tools, 1341); Sodium Chloride (Sigma-Aldrich, S7653); Ammonium Persulfate (APS) (Sigma-Aldrich, A36378); N,N,N′,N′-Tetramethylethylenediamine (TEMED) (Sigma-Aldrich, T7024); Proteinase K (New England Biolabs, P8107S); Ethylenediaminetetraacetic acid (EDTA) (Sigma-Aldrich, EDS); Guanidine hydrochloride (Sigma-Aldrich, G3272); Tris (Thermo Fisher, AM9855); NuPAGE LDS Sample Buffer (4X) (Thermo Fisher, NP0007); 4–12% Bis-Tris Protein Gels, 1.0 mm, 12-well (Thermo Fisher, NP0322BOX); NuPAGE MOPS SDS Running Buffer (20X) (Thermo Fisher, NP0001); SYPRO Tangerine Protein Gel Stain (Thermo Fisher, S12010); PageRuler Plus Prestained 10 250kDa Protein Ladder (Thermo Fisher, PI26619); Dithiothreitol (DTT) (Fisher Scientific, FERR0861); Acetic acid (Sigma Aldrich, 695092); Sodium phosphate dibasic (Sigma Aldrich, 795410); Gold Etchant (Sigma-Aldrich, 651842); Gold Standard 1000 μg/mL (High Purity Standards, 100021-2); Iridium Standard 1000 μg/mL (High Purity Standards, 100025-2); 0.22 μm Syringe Filter (Sigma, SLGP033NB); LoBind Microcentrifuge Tubes (Sigma-Aldrich, Z666491); 18 mm Round Coverslips #1 (VWR, 16004-300); #1.5H Glass Bottom Dishes (Fisher Scientific, 50-305-807); 12-Well Cell Culture Plate (VWR, 10062-894); 6-Well Cell Culture Plate (VWR, 10062-892); Cell Scrapers (Fisher, 08-100-241); TEM Grid, Carbon Type-B, 300 Mesh, Copper (Ted Pella, 01813-F); Uranyl Acetate (Ted Pella, 19481); Lead Citrate, UranyLess EM Stain (Electron Microscopy Sciences, 22409); Sodium Tartrate Dibasic Dihydrate (Sigma-Aldrich, 71994); Sodium DL-Lactate (Sigma-Aldrich, 71720); Sodium Pyruvate (Sigma-Aldrich, P5280); Calcium Chloride Dihydrate (Sigma-Aldrich, C3306); Magnesium Chloride (Sigma-Aldrich, M8266); Sodium Sulfate (Sigma-Aldrich, 239313); Citric Acid (Fisher Scientific, MK-0627-500)
Methods
Gold Nanoparticle (AuNP) Synthesis and PEGylation
Fifty-five nm citrate-coated gold nanoparticles (AuNPs) were synthesized using previously reported methods.36,37 A 250-mL reaction flask and magnetic stir bar were cleaned using an aqua regia solution made from 37 % HCl and 70% HNO3 and in a 3:1 ratio (v/v) for 15 minutes and then thoroughly washed with deionized water. Next, 98.9 g of ultrapure H2O (18.2 MΩ,) was added to the flask along with 1 mL of 30 mg/mL sodium citrate tribasic dihydrate and was brought to a boil on a hotplate set to 300°C and stirring at 200 rpm. One hundred μL of 250 mM of gold (III) chloride solution (HAuCl4) was added to the flask and stirring was increased to 400 rpm for 7 minutes to produce 14-nm AuNPs seeds. Flasks were then cooled and the hydrodynamic diameter and polydispersity index (PDI) of the AuNPs were measured using the Malvern Zetasizer Nano ZS dynamic light scattering (DLS). Gold nanoparticles with a polydispersity index (PDI) >0.1 were discarded. The concentrations of the AuNPs were calculated using absorbance readings from an Agilent Cary 5000 UV-Vis-NIR (UV-Vis) spectrophotometer.
Subsequently, 55-nm AuNPs were synthesized via seed-mediated growth using the 14-nm AuNPs.37,54 In short, 95.63 mL of ultrapure H2O, 0.986 mL of 25-mM HAuCl4, 0.986 mL of 15-mM sodium citrate tribasic, 1.41 mL of 2.5-nM of 14-nm AuNPs, and 0.986 mL of 25-mM hydroquinone were added to a clean flask at room temperature (RT) and stirred at 400 rpm overnight. The DLS and UV-Vis spectrophotometry measurements were taken, and then 1 mL of 10% (v/v) Tween 20 was added to the flask and stirred. The AuNPs were then concentrated by centrifugation at 2,000 ×g (RCF, relative centrifugal force) for 2 hours at 4°C. The supernatants were removed, and the nanoparticles were resuspended in a solution of 0.01% (v/v) Tween 20 and 0.01% (w/v) sodium citrate tribasic dihydrate (Tween-citrate) and were then centrifuged at 2,000 ×g for 30 minutes at 4°C and resuspended in Tween-citrate three times. The citrate-coated AuNPs were coated with 10-kDa MW methoxy-polyethylene glycol-OPSS (mPEG-OPSS) to surface area saturation for 30 minutes at RT. Surface saturation was defined as the point of increasing PEG molecules/nm2 of AuNP surface area at which the increase of the hydrodynamic diameter of the AuNPs plateaus, as measured by DLS.37 Excess PEG was removed by centrifugation at 2,200 ×g for 30 minutes at 4°C and resuspended in 0.05% (v/v) Tween 20 in PBS three times.
To synthesize Cy5-PEG, first a solution of 100 mg/mL 5-kDa amine-PEG-thiol (NH2-PEG-SH) in 0.1 M of sodium bicarbonate was oxidized in 0.5 molar equivalents of sodium tetrathionate for 1 hour, as described by Dai et al.64 The solution was dialyzed with a Pierce Minidialysis unit with a molecular weight cutoff of 3.5 kDa for 1 hour with gentle stirring on a stir plate at RT. The pH of the solution was then adjusted to 8.0 using sodium bicarbonate, and 0.5 mg of Cy5-NHS ester was added to solution and vortexed for 3 hours. DTT (100 molar equivalents) was added to the solution and incubated for 1 hour. The solution was passed through a NAP-25 column equilibrated with 0.1 M sodium bicarbonate (pH 8.0), and excess dye was removed using a 3.5-kDa molecular weight (mW) dialysis membrane overnight at 4°C against deionized H2O. Cy5-AuNPs were formed by coating Cy5-PEG onto the 55-nm citrate-coated AuNPs at a density of 0.5 Cy5-PEG/nm2 of NP surface area for 30 minutes, with centrifugations to remove excess PEG as previously described. The Cy5-AuNPs were then coated to surface area saturation with 10-kDa mPEG-OPSS similarly to the citrate-coated AuNPs. Fluorescence emission spectra were measured using a Horiba PTI Quantamaster Spectrofluorometer.
Heparosan-coated 55-nm gold nanoparticles (HEP-AuNPs) were synthesized through a pH reduction method as described by Yang et al.39,40 Briefly, 13-kDa HEP-OPSS was mixed with dilute HCl solution with a pH of 3.0. The solution was then mixed with citrate-coated AuNPs and was incubated at room temperature (RT) for 5 minutes. Saline was then added to the solution to a final concentration of 0.3 M and was incubated at RT for 20 minutes. More NaCl was then added to the solution to a final concentration to 0.7 M. Excess HEP and NaCl were removed by centrifugation at 2,300 ×g for 30 minutes at 4°C and resuspension in 0.05% (v/v) Tween 20 in PBS thrice.
Bovine serum albumin-coated 55-nm gold nanoparticles (BSA-AuNPs) were made through a direct incubation of the Tween 20 and citrate-coated AuNPs in a 10-mg/mL solution of BSA in 1X PBS for 1 hour at 37°C. Excess BSA was removed by centrifugation at 2,300 ×g for 30 minutes with pellet resuspension in 1X PBS thrice.
Cell Culture
The 4T1 cells and RAW 264.7 macrophages were grown in culture media consisting of DMEM supplemented with 10% FBS and 1% penicillin/streptomycin. The DC 2.4 cells were grown in RPMI 1640 supplemented with 10% FBS and 1% penicillin/streptomycin. During passages, 0.25% trypsin-EDTA was used to detach 4T1 and DC 2.4 cells from culture flasks, while cell scrapers were used for the RAW 264.7 cells. Prior to plating cells, 18-mm glass coverslips were cleaned using piranha solution (3:1 (v/v) 95% sulfuric acid: 30% hydrogen peroxide) for 15 minutes before being washed with ultrapure H2O three times, placed in 12-well plates, and sterilized by UV light in a biosafety hood for 10 minutes. The coverslips were then incubated in 2-mg/mL gelatin for 2 hours and washed with 1X PBS three times. Cells in complete culture media were plated on to the coverslips in 12-well culture plates at a density of 30,000 cells/well and were allowed to adhere overnight. All AuNP incubations with cells were at a concentration of 200 pM AuNP in culture media for 24 hours in 4T1 cells and 3 hours in DC 2.4 cells and RAW 264.7 macrophages, based on previously published work with these conditions.39,40 All AgNP incubations with RAW 264.7 macrophages were at 1:10 dilutions from the purchased stock concentrations in cell culture media for 24 hours, which would approximately be 28.4 pM for the 40-nm Strep-AgNPs and 8.4 pM for the 60-nm Strep-AgNPs. Following the incubations, the cells were washed with 1X PBS thrice before fixation and further processing.
Cell Expansion
Four X expansion was performed based on the proExM protocol described by Boyden et al.32 Briefly, cell samples grown on 18-mm glass coverslips were fixed with 4% PFA and permeabilized with 0.1% Triton X-100 before being incubated in 3% BSA for 10 minutes and stained with DAPI and WGA CF488A or NHS-AF555. Samples were treated with 100 μL of 0.1 mg/mL Acryloyl-X, SE on strips of parafilm in a humidified chamber for 6 hours. Polyacrylamide monomer solutions were made as 86 mg/mL sodium acrylate, 25 mg/mL acrylamide, 1.5 mg/mL N, Bis, and 117 mg/mL sodium chloride. Active gelation solutions were formed with 470 μL of monomer solution, 10 μL of ultrapure H2O, 10 μL of 10% APS, and 10 μL of TEMED. Immediately following the addition of the APS and TEMED, the active gelation solution was vortexed, and 200 μL of the solution was injected between the samples and a cover slip and was allowed to form a gel for 1 hour. The structural proteins in the cells were digested in 1 mL of a digestion buffer (50 mg/mL Triton X-100, 1 mM EDTA, 50 mM Tris-Cl, 46.7 mg/mL sodium chloride, 8 U/mL proteinase K, pH adjusted to 8.0 with HCl) overnight in a humidified chamber at 55°C. The gels were placed in petri dishes and filled with ultrapure H2O for expansion. The ultrapure H2O was aspirated out and replaced after 20 minutes 3–4 times to allow for full gel expansion.
Pan-ExM was performed based on a protocol described by Bewersdorf et al.16 Cells were fixed with a solution of 3% PFA and 0.1% glutaraldehyde in 1X PBS for 15 minutes and then washed 3X with PBS. The samples were quenched with 1 mg/mL sodium borohydride in PBS for 10 minutes and then 100 mM of glycine in 1X PBS for 20 minutes before being washed 3 times with PBS. Samples were then incubated in a solution of 0.7% PFA and 0.1% acrylamide in 1X PBS for 6 hours at 37°C and then washed thrice with 1X PBS. Gel monomer solutions were prepared as 19% (w/v) sodium acrylate, 10% (w/v) acrylamide, and 0.1% (w/v) DHEBA in PBS. Activated gel solutions were prepared with 198 μL of monomer solution with 1 μL of 50% APS and 1 μL of 50% TEMED. 90 μL of active gel solution was injected between the samples and a cover slip, and were allowed to form a gel for 15 minutes at RT and then 1.5 hours at 37°C. Samples were then incubated in a digestion buffer made of 200 mM SDS, 200 mM NaCl, and 50 mM Tris in ultrapure H2O (pH adjusted to 6.7 with HCl) for 15 minutes at RT and then for 1 hour at 37°C. A small portion of the gels were then expanded in a similar manner as the 4X gels. A portion of the expanded gels were then re-embedded in a neutral hydrogel, with a monomer solution consisting of 10% (w/v) acrylamide and 0.05% (w/v) DHEBA in 1X PBS. Activated gel solutions were made with 2,970 μL of monomer solution, 15 μL of 10% (w/v) APS, and 15 μL of 10% (v/v) TEMED, which the samples are incubated in at RT on an orbital shaker 3 times for 20 minutes each. The samples were then gently pressed with Kimwipe paper wipes to remove excess solution before being placed between a coverslip and glass slide and placed in a humified chamber. Oxygen was purged from the chamber and replaced with nitrogen, and the sample was incubated for 2 hours at 37°C. The samples were then incubated in a second gel solution, with a monomer solution consisting of 19% (w/v) sodium acrylate, 10% (w/v) acrylamide, and 0.1% (w/v) Bis in 1X PBS. Once again, activated gel solutions were made with 2,970 μL of monomer solution, 15 μL of 10% (w/v) APS, and 15 μL of 10% (v/v) TEMED, which the samples are incubated in on ice on an orbital shaker thrice for 15 minutes each. The steps following the neutral gel embedding until the second gel incubation are repeated for this gel. Following the 2-hour incubation in the nitrogen chamber, samples were incubated in a 200-mM NaOH solution for 1 hour and then washed with 1X PBS thrice for 30 minutes each. Samples were then stained with a 20 μg/mL solution of AF555Dye NHS ester in a 100-mM sodium bicarbonate solution for 1.5 hours on an orbital shaker and were then washed with 1X PBS at least three times for 20 minutes each until the gels were visibly clear. The samples were then expanded in a similar manner to the 4X gels.
Confocal Microscopy
To prevent gels from sliding while imaging, they were first placed on a 35-mm #1.5H glass bottom dish. Henkel Duro brand super glue was applied around the bottom edge of the gel and the plate and was allowed to harden for 10–15 minutes. The tops of the gels were lightly washed with ultrapure H2O to remove any superglue that had crusted over, and a round 18-mm coverglass was placed on top of each gel. Following this, a stiff acrylamide gel, consisting of 18.4% acrylamide and 1.6% Bis65, (activated with 1960 μL of monomer solution, 20 μL of 10% APS, and 20 μL of TEMED) was poured over the glass and gels until they are fully submerged. Ultrapure H2O was then poured over the gels to prevent drying until imaging.
Fluorescence images were taken on a Zeiss LSM 880 confocal laser scanning microscope (CLSM) on the Zeiss Zen Black software using a 40X water immersion objective (NA=1.20) and a 405-nm diode laser, 488-nm argon laser, 561-nm diode-pumped solid-state laser, a 594-nm helium-neon laser, and a 633-nm helium-neon laser with a main beam splitter (MBS) 488/561/633 filter and photomultiplier tube (PMT) detectors. Transmitted light images were acquired through a 405-nm diode laser through a main beam splitter 488/561/633 filter to the PMT detector (T-PMT). The AuNP signal was acquired using light scattering principles described by Jiang et al.23 with the 561-nm laser and a MBS T80/R20 filter, using a 1.5–20% laser power for unexpanded and 4X samples, and a 45% laser power for pan-ExM samples. The detector range for light scattering on samples that were not stained with AF55-NHS was 561 +/− 10 nm. For samples that were stained with AF555-NHS, the detector range was 561 +/− 5 nm to reduce crosstalk from the AF555. Airyscan images were acquired using the Airyscan detector on the Zeiss LSM 880 CLSM with a 63X Oil immersion objective (NA=1.40). The standard CLSM images used to compare against the Airyscan images in Figure S16 were also taken with 63X Oil immersion objective (NA=1.40).
Image Analysis
Cell nuclei cross-sectional areas, whole cell nanoparticle light scattering signal intensities and fluorescence signal intensities were measured on ImageJ.
To confirm the successful adoption of the proExM protocol, we randomly selected CLSM images of 90 non-expanded and expanded cells taken at the z-positions where their nuclei have their largest cross-sectional area. Next, we applied common thresholding methods in ImageJ66 to measure the cross-sectional areas of the corresponding cell nuclei. The thresholded images were despeckled by erosion operations, which were then corrected by dilation operations. Adjacent nuclei were separated with watershed segmentation. The pixel areas of the thresholded nuclei were measured, which were then converted to units of μm2 via the image scale factor. We then calculated the resulting linear expansion factor of ~4.1X using Equation 1,
| Equation 1 |
where and refer to the mean areas of the measured nuclei in non-expanded and expanded cells, respectively.
To quantify the increase in image resolution, we applied a grid of equally spaced lines across the images of non-expanded and expanded nuclei and measured the pixel intensities corresponding to a blue-fluorescent DNA stain, DAPI, along these lines (Figure S2a). We counted the peak numbers in the pixel intensity graphs across the line profiles for each analyzed nucleus and divided that count by the total length of the line profiles to determine the number of intensity peaks/μm as an unbiased measurement of resolution. The lengths of the line profiles across expanded nuclei were scaled down by the previously determined expansion factor of 4.1X for comparison against the non-expanded nuclei.
To randomly select cells for analysis, all the cells on each imaging frame were measured and collectively assigned a number tag from a random number generator. These number tags were then arranged in numerical order, allowing for any number of random cells to be selected from the top of the list. For nanoparticle light scattering and fluorescence signal intensities, the brightness of each channel was first set through the histogram in the Zen Lite software, before individual regions of interest were drawn around the membranes of the cells in ImageJ, and the integrated density was measured for the signals of interest. Outliers were removed based on Tukey’s method.67
Nanoparticle light scattering signal counting, as well as cell and vesicle volumes for pan-ExM samples, were analyzed with MATLAB. The NHS-AF555 signal was set to appear gray and the light scattering channel was set to appear red, and then Z-stacks were converted from 12-bit images into 8-bit RGB images, having pixel values ranging from 0 to 255, through Zen Lite. Only the R channel was analyzed given that the NHS-AF555 was equivalent to grayscale and the light scattering signal had pixel values of 0 for the G and B channels. For nanoparticle counting, we found and utilized several useful patterns. First, the pixel values of the background areas in controls were equal or smaller than 10. This means that thresholds up to 10 may cause background noise to be counted towards nanoparticle signal counts. To safely filter out the background noise, three times the noise level was used as a reliable threshold (i.e. 30). Second, we observed that each nanoparticle occupied a grid of size 3×3 with the brightest pixel located in the center. Given a nanoparticle, denote the brightest pixel value as P, then the values of the surrounding eight pixels fell within [1, P]. By considering these two important patterns, our algorithm calculated the number of nanoparticles and the area occupied. The volumes of the cells, as well as the cumulative nanoparticle and vesicle volumes, were approximated by the summation of the areas of each respective category throughout the entire Z-stacks. To delineate cell boundary, Otsu’s method68 was first used to choose an optimal threshold and create a binary image where cell regions are separated from background. This method works by minimizing the intraclass variance of the thresholded cell and background pixels. Then, morphological operations (e.g., dilation, erosion, image opening, etc.) were applied to fill small holes, remove small, isolated regions to obtain a refined cell mask, denoted as M1. In this mask, white pixels represent cell, whereas black pixels are background and vesicles. Most vesicles (black holes) were located inside the mask, and the rest located on the boundary of the mask. We further applied a series of morphological operations to fill out the black holes. This resulted in a much more compact cell mask denoted as M2, and cell area was calculated using this mask. Subtracting M1 from M2 resulted in a map where all vesicle regions were highlighted. Morphological operations were further applied to refine the results and generate a final mask M3 depicting vesicle regions. With the compact cell and vesicle masks, we computed cell and vesicle areas. When calculating the number of red dots areas that fall in vesicle regions, it should be noted that we purposely lowered the red dot threshold to 20. This can more accurately reflect the area of nanoparticles because the area of less bright surrounding pixels is considered instead of only considering the brightest pixels.
Transmission Electron Microscopy (TEM)
TEM images of gold nanoparticles were acquired using a JEOL2010F 200-kV field emission analytical transmission electron microscope with a DE-12 camera on copper TEM grids. Negative staining was done with 0.2% uranyl acetate. TEM images of cell samples were acquired using a Hitachi H-7600 Transmission Electron Microscope. Cells were fixed in a solution of 2% (v/v) glutaraldehyde and 4% paraformaldehyde (v/v) in 0.2-M cacodylate buffer at room temperature for 1 hour and were then stored at 4°C until sectioning. Samples were negative stained with a 3% lead citrate solution.
Sodium dodecyl sulfate-polyacrylamide gel electrophoresis (SDS-PAGE)
SDS-PAGE was run based on a protocol described by Yang et al.40 Briefly, samples with 20 cm2 of surface area of citrate-coated and PEGylated AuNPs were incubated in 700 μL of 100% fetal bovine serum (FBS) at 37°C for 16 hours in LoBind tubes (Eppendorf). Control samples were incubated in 1X PBS for PEGylated AuNPs and ultrapure H2O for citrate-coated AuNPs for better colloidal stability. The samples were then washed to remove free serum by centrifugation at 2,300 ×g for 30 minutes at 4°C and resuspension in 0.05% (v/v) Tween 20 in PBS (0.05% Tween 20 in ultrapure H2O for citrate-coated control) thrice. After the final centrifugation, the AuNP pellets were resuspended in 8 μL of 4X NuPAGE LDS sample buffer and 4 μL of 500-mM DTT and incubated at 70°C for 1 hour to separate adsorbed proteins from the surface of the AuNPs. The samples were then centrifuged at 18,000 ×g for 15 minutes to separate the removed proteins from the residual AuNPs. Supernatants were removed, and their volumes were equalized before the addition of 4 μL of 4X NuPAGE LDS sample buffer and 2 μL of 500-mM DTT and an incubation at 95°C for 5 minutes to completely denature the proteins. Following the denaturation, 20 μL of protein samples and 2 μL of 10–250 kDa protein ladder were loaded onto a 4–12% Bis-Tris protein gel in MOPS SDS running buffer, and were run at 200 V for 50 minutes. The gel was then removed from its encasing and rinsed with deionized water several times. The gel was fixed with 10% (v/v) acetic acid and 40% (v/v) ethanol overnight on an orbital shaker. After rinsing with deionized water, the gel was stained with 50 mL of 1X SYPRO Tangerine in 50-mM sodium phosphate dibasic and 150-mM sodium chloride for 1 hour on an orbital shaker. The gel was then rinsed with deionized water, and then imaged on an Azure C600 gel imager. A similar procedure was done with BSA-AuNPs and free BSA.
Inductively Coupled Plasma Mass Spectrometry (ICP-MS)
Gold and iridium 1,000-μg/mL standard solutions were used to create a standard calibration curve for ICP-MS measurements. A 0.5-ppb iridium-acid water solution was made in 20-mM HNO3 and 60-mM HCl in ultrapure H2O, which is used for serial dilutions of the gold standard to make samples with gold contents of 200 μg/mL, 100 μg/mL, 50 μg/mL, 10 μg/mL, 5 μg/mL, and 1 μg/mL, with a 0 μg/mL sample being pure 0.5-ppb iridium-acid water. 4T1 cells were cultured directly on 12-well culture plates at a density of 100,000 cells/well and were incubated with 200-pM of PEG-AuNPs in complete culture media for 24 hours, or just complete culture media for controls, and were then washed with PBS thrice. RAW 264.7 cells were cultured in similar conditions and incubated with 200-pM of HEP-AuNPs or PEG-AuNPs. Cell standard curves were prepared for both cell lines with samples ranging from 6×10⁴ to 2×10⁶ cells as a basis of intracellular magnesium contents. Solutions from the proExM process were centrifuged at 4,000 ×g for 30 minutes to pellet AuNPs, and the supernatants were removed. Samples were then digested with an aqua regia solution composed of 70% HNO3 and 37% HCl in a 4:1 ratio (V/V) for 30 minutes at room temperature. Following digestion, samples were transferred to 1.5-mL tubes and incubated at 60°C for 1 hour. Samples were then cooled and pulsed on a centrifuge before being diluted in a 1:10 or 1:20 ratio in 0.5-ppb iridium solution in ultrapure H2O, without HCl or HNO3. Samples from the proExM process were filtered through 0.22-μm syringe filters. Au197 and Mg24 content measurements were taken with a PerkinElmer NexIon 2000 ICP-MS using the Prepfast IC Sample Introduction system. The gold and cell standard curves were used to calculate the number of AuNPs/cell.
When running residual solutions from proExM through ICP-MS, a significant difference in the detected gold content of cells that were treated with AuNPs compared to untreated controls at the first step, the Acryloyl-X, SE treatment (****p<0.0001) was detected (Figure S14b). It is not likely that the gold content that was detected in this step is from intracellular AuNPs that were removed from the cell in this step, given that this treatment is not a destructive process. It is more likely that the detected gold content was from uninternalized AuNPs that were stuck to the glass coverslip, which had been mechanically dislodged during the Acryloyl-X treatment. The next group that was digested for ICP-MS was the bottom coverslip that the cells had been grown on following the removal of the hydrogel. A significant difference in the detected gold content between the two groups was also detected here (**p<0.01). However, it is once again not likely that this difference originated from lost intracellular AuNPs, but rather from cells that were not transferred to the gel, given that the gel would not cover the entire top surface area of the coverslip. Furthermore, small pieces of the gel tend to tear off the top coverslip as it is being separated from the bottom coverslip, resulting in more AuNP-containing cells being measured through ICP-MS at this step. There was not a significant difference in the detected gold content between the two groups (p>0.99) in the digestion buffer, the top coverslip after the gels were peeled off, or the combination of the three washes that the gels were expanded in. Given that the digestion buffer and expansion washes are directly involved in the chemical and physical disruption of the mechanical structure of the cells, it would be expected that any intracellular AuNPs that would be lost would be found within those solutions.
To test the colloidal stability of HEP- and PEG-AuNPs in intracellular conditions, the AuNPs were incubated in ultrapure H2O, culture media (DMEM), complete culture media (DMEM +10% FBS + 1% penicillin streptomycin (P/S)), or artificial lysosomal fluid for 3 hours at 37°C. The artificial lysosomal fluid was prepared based on specifications described by Innes et al.53 Following the incubation, the AuNPs were centrifuged at 2,300 ×g for 30 minutes and resuspended in Tween-citrate twice. The AuNPs were then diluted to a concentration of 3×10⁻¹⁶ M and measured on the PerkinElmer NexION 2000 ICP-MS in single-particle mode.38,54
Supplementary Material
Acknowledgments
The authors thank N. Koc, A. Karim, E. Joyce, S. Butterfield, M. Haddad, Y. He, and S. Lyu for their assistance with experiments. We also thank Drs. B. Zheng, T. Gu, S. Foster, and J. Grime as well as B. Fowler, J. Wilge, and J. Crane for their assistance, and the Chen Lab for kindly providing the DC 2.4 cells. We also thank P. Kidd and Dr. Y. Tian for providing training on pan-Expansion Microscopy. Additionally, the authors acknowledge the University of Oklahoma (OU) Samuel Roberts Noble Microscopy Laboratory (SRNML), the OU Mass Spectrometry, Proteomics & Metabolomics (MSPM) Core, the Oklahoma Medical Research Foundation (OMRF) Imaging Core Facility, and the Oklahoma COBRE in Cancer Imaging Research (Oklahoma Center of Medical Imaging for Translational Cancer Research). This work was supported in part by awards from NIH COBRE (P20GM135009), NSF CAREER (2048130), and OCAST HR20-106. J.B. acknowledges support by the Wellcome Trust (203285/B/16/Z) and NIH (P30 DK045735).
Footnotes
Conflict of Interest
J.B. has financial interests in Bruker Corp. and Hamamatsu Photonics. O.M. and J.B. filed patent applications with the U.S. Patent and Trademark Office covering pan-ExM methods. O.M. and J.B. are co-founders of panluminate Inc. which is developing related products. The remaining authors have no other conflicts of interest.
Supporting Information
This material is available free of charge via the internet at http://pubs.acs.org. The supporting information includes supplementary figures S1–S19 detailing nanoparticle characterization and validation of imaging methods, and additional tables on nanoparticle characterization and method validation. There are two supporting movies provided that show Z-stacks of cells obtained with inverted confocal laser scanning microscopy.
Data Availability
The data and code used from this study will be posted to FigShare.
References
- (1).Hua S; de Matos MBC; Metselaar JM; Storm G Current Trends and Challenges in the Clinical Translation of Nanoparticulate Nanomedicines: Pathways for Translational Development and Commercialization. Front. Pharmacol. 2018, 9 (JUL), 1–14. 10.3389/fphar.2018.00790. [DOI] [PMC free article] [PubMed] [Google Scholar]
- (2).Kumari S; Mg S; Mayor S Endocytosis Unplugged: Multiple Ways to Enter the Cell. Cell Res. 2010, 20 (3), 256–275. 10.1038/cr.2010.19. [DOI] [PMC free article] [PubMed] [Google Scholar]
- (3).Rennick JJ; Johnston APR; Parton RG Key Principles and Methods for Studying the Endocytosis of Biological and Nanoparticle Therapeutics. Nat. Nanotechnol. 2021, 16 (3), 266–276. 10.1038/s41565-021-00858-8. [DOI] [PubMed] [Google Scholar]
- (4).Malatesta M Transmission Electron Microscopy as a Powerful Tool to Investigate the Interaction of Nanoparticles with Subcellular Structures. Int. J. Mol. Sci. 2021, 22 (23). 10.3390/ijms222312789. [DOI] [PMC free article] [PubMed] [Google Scholar]
- (5).Egerton RF; Watanabe M Spatial Resolution in Transmission Electron Microscopy. Micron 2022, 160 (May), 103304. 10.1016/j.micron.2022.103304. [DOI] [PubMed] [Google Scholar]
- (6).Harris KM; Perry E; Bourne J; Feinberg M; Ostroff L; Hurlburt J Uniform Serial Sectioning for Transmission Electron Microscopy. J. Neurosci. 2006, 26 (47), 12101–12103. 10.1523/JNEUROSCI.3994-06.2006. [DOI] [PMC free article] [PubMed] [Google Scholar]
- (7).Jonkman J; Brown CM; Wright GD; Anderson KI; North AJ Tutorial: Guidance for Quantitative Confocal Microscopy. Nat. Protoc. 2020, 15 (5), 1585–1611. 10.1038/s41596-020-0313-9. [DOI] [PubMed] [Google Scholar]
- (8).Jackson W; Yamada M; Moninger T; Grose C Visualization and Quantitation of Abundant Macroautophagy in Virus-Infected Cells by Confocal Three-Dimensional Fluorescence Imaging. J. Virol. Methods 2013, 193 (1), 244–250. 10.1016/j.jviromet.2013.06.018. [DOI] [PMC free article] [PubMed] [Google Scholar]
- (9).Sindhwani S; Syed AM; Wilhelm S; Glancy DR; Chen YY; Dobosz M; Chan WCW. Three-Dimensional Optical Mapping of Nanoparticle Distribution in Intact Tissues. ACS Nano 2016, 10 (5), 5468–5478. 10.1021/acsnano.6b01879. [DOI] [PubMed] [Google Scholar]
- (10).Syed AM; Sindhwani S; Wilhelm S; Kingston BR; Lee DSW; Gommerman JL; Chan WCW Three-Dimensional Imaging of Transparent Tissues via Metal Nanoparticle Labeling. J. Am. Chem. Soc. 2017, 139 (29), 9961–9971. 10.1021/jacs.7b04022. [DOI] [PubMed] [Google Scholar]
- (11).Sindhwani S; Syed AM; Wilhelm S; Chan WCW. Exploring Passive Clearing for 3D Optical Imaging of Nanoparticles in Intact Tissues. Bioconjug. Chem. 2017, 28 (1), 253–259. 10.1021/acs.bioconjchem.6b00500. [DOI] [PubMed] [Google Scholar]
- (12).Syed AM; MacMillan P; Ngai J; Wilhelm S; Sindhwani S; Kingston BR; Wu JLY; Llano-Suárez P; Lin ZP; Ouyang B; Kahiel Z; Gadde S; Chan WCW Liposome Imaging in Optically Cleared Tissues. Nano Lett. 2020, 20 (2), 1362–1369. 10.1021/acs.nanolett.9b04853. [DOI] [PubMed] [Google Scholar]
- (13).Betzig E; Trautman JK Near-Field Optics: Microscopy, Spectroscopy, and Surface Modification beyond the Diffraction Limit. Science (80-.). 1992, 257 (5067), 189–195. 10.1126/science.257.5067.189. [DOI] [PubMed] [Google Scholar]
- (14).Galbraith CG; Galbraith JA Super-Resolution Microscopy at a Glance. J. Cell Sci. 2011, 124 (10), 1607–1611. 10.1242/jcs.080085. [DOI] [PMC free article] [PubMed] [Google Scholar]
- (15).Chen F; Tillberg PW; Boyden ES Expansion Microscopy. Science (80-.). 2015, 347 (6221), 543–548. 10.1126/science.1260088. [DOI] [PMC free article] [PubMed] [Google Scholar]
- (16).M’Saad O; Bewersdorf J Light Microscopy of Proteins in Their Ultrastructural Context. Nat. Commun. 2020, 11 (1), 3850. 10.1038/s41467-020-17523-8. [DOI] [PMC free article] [PubMed] [Google Scholar]
- (17).Sousa De Almeida M; Susnik E; Drasler B; Taladriz-Blanco P; Petri-Fink A; Rothen-Rutishauser B Understanding Nanoparticle Endocytosis to Improve Targeting Strategies in Nanomedicine. Chem. Soc. Rev. 2021, 50 (9), 5397–5434. 10.1039/d0cs01127d. [DOI] [PMC free article] [PubMed] [Google Scholar]
- (18).Xiao Y; Xu W; Komohara Y; Fujiwara Y; Hirose H; Futaki S; Niidome T Effect of Surface Modifications on Cellular Uptake of Gold Nanorods in Human Primary Cells and Established Cell Lines. ACS Omega 2020, 5 (50), 32744–32752. 10.1021/acsomega.0c05162. [DOI] [PMC free article] [PubMed] [Google Scholar]
- (19).Rodriguez-Lorenzo L; Fytianos K; Blank F; von Garnier C; Rothen-Rutishauser B; Petri-Fink A Fluorescence-Encoded Gold Nanoparticles: Library Design and Modulation of Cellular Uptake into Dendritic Cells. Small 2014, 10 (7), 1341–1350. 10.1002/smll.201302889. [DOI] [PubMed] [Google Scholar]
- (20).Cauzzo J; Nystad M; Holsæter AM; Basnet P; Škalko-Basnet N Following the Fate of Dye-Containing Liposomes in Vitro. Int. J. Mol. Sci. 2020, 21 (14), 1–17. 10.3390/ijms21144847. [DOI] [PMC free article] [PubMed] [Google Scholar]
- (21).Donahue ND; Acar H; Wilhelm S Concepts of Nanoparticle Cellular Uptake, Intracellular Trafficking, and Kinetics in Nanomedicine. Adv. Drug Deliv. Rev. 2019, 143, 68–96. 10.1016/j.addr.2019.04.008. [DOI] [PubMed] [Google Scholar]
- (22).Mettenbrink EM; Yang W; Wilhelm S Bioimaging with Upconversion Nanoparticles. Adv. Photonics Res. 2022, 3 (12), 2200098. 10.1002/adpr.202200098. [DOI] [PMC free article] [PubMed] [Google Scholar]
- (23).Wang F; Chen B; Yan B; Yin Y; Hu L; Liang Y; Song M; Jiang G Scattered Light Imaging Enables Real-Time Monitoring of Label-Free Nanoparticles and Fluorescent Biomolecules in Live Cells. J. Am. Chem. Soc. 2019, 141 (36), 14043–14047. 10.1021/jacs.9b05894. [DOI] [PubMed] [Google Scholar]
- (24).Tillberg PW; Chen F; Piatkevich KD; Zhao Y; Yu CC; English BP; Gao L; Martorell A; Suk HJ; Yoshida F; Degennaro EM; Roossien DH; Gong G; Seneviratne U; Tannenbaum SR; Desimone R; Cai D; Boyden ES Protein-Retention Expansion Microscopy of Cells and Tissues Labeled Using Standard Fluorescent Proteins and Antibodies. Nat. Biotechnol. 2016, 34 (9), 987–992. 10.1038/nbt.3625. [DOI] [PMC free article] [PubMed] [Google Scholar]
- (25).Truckenbrodt S; Maidorn M; Crzan D; Wildhagen H; Kabatas S; Rizzoli SO X10 Expansion Microscopy Enables 25-nm Resolution on Conventional Microscopes. EMBO Rep. 2018, 19 (9), 1–12. 10.15252/embr.201845836. [DOI] [PMC free article] [PubMed] [Google Scholar]
- (26).Damstra HG; Mohar B; Eddison M; Akhmanova A; Kapitein LC; Tillberg PW Visualizing Cellular and Tissue Ultrastructure Using Ten-Fold Robust Expansion Microscopy (TREx). Elife 2022, 11, 1–52. 10.7554/eLife.73775. [DOI] [PMC free article] [PubMed] [Google Scholar]
- (27).Chang JB; Chen F; Yoon YG; Jung EE; Babcock H; Kang JS; Asano S; Suk HJ; Pak N; Tillberg PW; Wassie AT; Cai D; Boyden ES Iterative Expansion Microscopy. Nat. Methods 2017, 14 (6), 593–599. 10.1038/nmeth.4261. [DOI] [PMC free article] [PubMed] [Google Scholar]
- (28).Zhao Y; Bucur O; Irshad H; Chen F; Weins A; Stancu AL; Oh EY; Distasio M; Torous V; Glass B; Stillman IE; Schnitt SJ; Beck AH; Boyden ES Nanoscale Imaging of Clinical Specimens Using Pathology-Optimized Expansion Microscopy. Nat. Biotechnol. 2017, 35 (8), 757–764. 10.1038/nbt.3892. [DOI] [PMC free article] [PubMed] [Google Scholar]
- (29).Nakamoto ML; Forró C; Zhang W; Tsai C; Cui B Expansion Microscopy for Imaging the Cell–Material Interface. ACS Nano 2022. 10.1021/acsnano.1c11015. [DOI] [PMC free article] [PubMed] [Google Scholar]
- (30).Sim J; Park CE; Cho I; Min K; Lee J-S; Chong Y; Kim J; Kang JS; Piatkevich KD; Jung EE; Kwon S-K; Yoon Y-G; Boyden ES; Chang J-B Nanoscale Resolution Imaging of the Whole Mouse Embryos and Larval Zebrafish Using Expansion Microscopy. 2022, May.18.443629. bioRxiv. 10.1101/2021.05.18.443629. (accessed 04 11, 2023) [DOI] [Google Scholar]
- (31).Sheth V; Wang L; Bhattacharya R; Mukherjee P; Wilhelm S Strategies for Delivering Nanoparticles across Tumor Blood Vessels. Adv. Funct. Mater. 2020, 2007363, 1–20. 10.1002/adfm.202007363. [DOI] [PMC free article] [PubMed] [Google Scholar]
- (32).Asano SM; Gao R; Wassie AT; Tillberg PW; Chen F; Boyden ES Expansion Microscopy: Protocols for Imaging Proteins and RNA in Cells and Tissues. Curr. Protoc. Cell Biol. 2018, 80 (1), 1–41. 10.1002/cpcb.56. [DOI] [PMC free article] [PubMed] [Google Scholar]
- (33).Alberts B; Johnson A; Lewis J; Raff M; Roberts K; Walter P Molecular Biology of the Cell (4th Ed); Taylor & Francis, London, UK, 2002; Vol. 37, 1463 10.1080/00219266.2002.9655847. [DOI] [Google Scholar]
- (34).Foroozandeh P; Aziz AA Insight into Cellular Uptake and Intracellular Trafficking of Nanoparticles. Nanoscale Res. Lett. 2018, 13. 10.1186/s11671-018-2728-6. [DOI] [PMC free article] [PubMed] [Google Scholar]
- (35).Chithrani BD; Ghazani AA; Chan WCW Determining the Size and Shape Dependence of Gold Nanoparticle Uptake into Mammalian Cells. Nano Lett. 2006, 6 (4), 662–668. 10.1021/nl052396o. [DOI] [PubMed] [Google Scholar]
- (36).Perrault SD; Chan WCW Synthesis and Surface Modification of Highly Monodispersed, Spherical Gold Nanoparticles of 50–200 Nm. J. Am. Chem. Soc. 2009, 131 (47), 17042–17043. 10.1021/ja907069u. [DOI] [PubMed] [Google Scholar]
- (37).Lee JC; Donahue ND; Mao AS; Karim A; Komarneni M; Thomas EE; Francek ER; Yang W; Wilhelm S Exploring Maleimide-Based Nanoparticle Surface Engineering to Control Cellular Interactions. ACS Appl. Nano Mater. 2020. 10.1021/acsanm.9b02541. [DOI] [Google Scholar]
- (38).Frickenstein AN; Mukherjee S; Harcourt T; He Y; Sheth V; Wang L; Malik Z; Wilhelm S Quantification of Monodisperse and Biocompatible Gold Nanoparticles by Single-Particle ICP-MS. Anal. Bioanal. Chem. 2023, No. 0123456789. 10.1007/s00216-023-04540-x. [DOI] [PMC free article] [PubMed] [Google Scholar]
- (39).Yang W; Frickenstein AN; Sheth V; Holden A; Mettenbrink EM; Wang L; Woodward AA; Joo BS; Butterfield SK; Donahue ND; Green DE; Thomas AG; Harcourt T; Young H; Tang M; Malik ZA; Harrison RG; Mukherjee P; DeAngelis PL; Wilhelm S Controlling Nanoparticle Uptake in Innate Immune Cells with Heparosan Polysaccharides. Nano Lett. 2022. 10.1021/acs.nanolett.2c02226. [DOI] [PMC free article] [PubMed] [Google Scholar]
- (40).Yang W; Wang L; Fang M; Sheth V; Zhang Y; Holden AM; Donahue ND; Green DE; Frickenstein AN; Mettenbrink EM; Schwemley TA; Francek ER; Haddad M; Hossen MN; Mukherjee S; Wu S; DeAngelis PL; Wilhelm S Nanoparticle Surface Engineering with Heparosan Polysaccharide Reduces Serum Protein Adsorption and Enhances Cellular Uptake. Nano Lett. 2022, 22 (5), 2103–2111. 10.1021/acs.nanolett.2c00349. [DOI] [PMC free article] [PubMed] [Google Scholar]
- (41).Green TA Gold Etching for Microfabrication. Gold Bull. 2014, 47 (3), 205–216. 10.1007/s13404-014-0143-z. [DOI] [Google Scholar]
- (42).Demchenko AP Photobleaching of Organic Fluorophores: Quantitative Characterization, Mechanisms, Protection. Methods Appl. Fluoresc. 2020, 8 (2). 10.1088/2050-6120/ab7365. [DOI] [PubMed] [Google Scholar]
- (43).Ho LWC; Chan CKW; Han R; Lau YFY; Li H; Ho Y; Zhuang X; Choi CHJ. Mammalian Cells Exocytose Alkylated Gold Nanoparticles via Extracellular Vesicles. ACS Nano 2022, acsnano.1c07418. 10.1021/acsnano.1c07418. [DOI] [PubMed] [Google Scholar]
- (44).Sheykhzadeh S; Luo M; Peng B; White J; Abdalla Y; Tang T; Mäkilä E; Voelcker NH; Tong WY Transferrin-Targeted Porous Silicon Nanoparticles Reduce Glioblastoma Cell Migration across Tight Extracellular Space. Sci. Rep. 2020, 10 (1), 1–16. 10.1038/s41598-020-59146-5. [DOI] [PMC free article] [PubMed] [Google Scholar]
- (45).Poon W; Zhang YN; Ouyang B; Kingston BR; Wu JLY; Wilhelm S; Chan WCW. Elimination Pathways of Nanoparticles. ACS Nano 2019, 13 (5), 5785–5798. 10.1021/acsnano.9b01383. [DOI] [PubMed] [Google Scholar]
- (46).Checa M; Millan-Solsona R; Mares AG; Pujals S; Gomila G Fast Label-Free Nanoscale Composition Mapping of Eukaryotic Cells Via Scanning Dielectric Force Volume Microscopy and Machine Learning. Small Methods 2021, 5 (7). 10.1002/smtd.202100279. [DOI] [PubMed] [Google Scholar]
- (47).Lazarovits J; Chen YY; Song F; Ngo W; Tavares AJ; Zhang YN; Audet J; Tang B; Lin Q; Cruz Tleugabulova M; Wilhelm S; Krieger JR; Mallevaey T; Chan WCW Synthesis of Patient-Specific Nanomaterials. Nano Lett. 2019, 19 (1), 116–123. 10.1021/acs.nanolett.8b03434. [DOI] [PubMed] [Google Scholar]
- (48).Nguyen VH; Lee B-J Protein Corona: A New Approach for Nanomedicine Design. Int. J. Nanomedicine 2017, Volume 12, 3137–3151. 10.2147/IJN.S129300. [DOI] [PMC free article] [PubMed] [Google Scholar]
- (49).Lakadamyali M; Rust MJ; Zhuang X Ligands for Clathrin-Mediated Endocytosis Are Differentially Sorted into Distinct Populations of Early Endosomes. Cell 2006, 124 (5), 997–1009. 10.1016/j.cell.2005.12.038. [DOI] [PMC free article] [PubMed] [Google Scholar]
- (50).Cox D; Lee DJ; Dale BM; Calafat J; Greenberg S A Rab11-Containing Rapidly Recycling Compartment in Macrophages That Promotes Phagocytosis. Proc. Natl. Acad. Sci. U. S. A. 2000, 97 (2), 680–685. 10.1073/pnas.97.2.680. [DOI] [PMC free article] [PubMed] [Google Scholar]
- (51).Sherry DM; Stiles MA Improved Fluorescent Signal in Expansion Microscopy Using Fluorescent Fab Fragment Secondary Antibodies. MethodsX 2022, 9 (June), 101796. 10.1016/j.mex.2022.101796. [DOI] [PMC free article] [PubMed] [Google Scholar]
- (52).Kong D; Loncarek J Analyzing Centrioles and Cilia by Expansion Microscopy. Methods in Molecular Biology. 2021, pp 249–263. 10.1007/978-1-0716-1538-6_18. [DOI] [PMC free article] [PubMed] [Google Scholar]
- (53).Innes E; Yiu HHP; McLean P; Brown W; Boyles M Simulated Biological Fluids–a Systematic Review of Their Biological Relevance and Use in Relation to Inhalation Toxicology of Particles and Fibres. Crit. Rev. Toxicol. 2021, 51 (3), 217–248. 10.1080/10408444.2021.1903386. [DOI] [PubMed] [Google Scholar]
- (54).Donahue ND; Francek ER; Kiyotake E; Thomas EE; Yang W; Wang L; Detamore MS; Wilhelm S Assessing Nanoparticle Colloidal Stability with Single-Particle Inductively Coupled Plasma Mass Spectrometry (SP-ICP-MS). Anal. Bioanal. Chem. 2020, 412 (22), 5205–5216. 10.1007/s00216-020-02783-6. [DOI] [PubMed] [Google Scholar]
- (55).Donahue ND; Sheth V; Frickenstein AN; Holden A; Kanapilly S; Stephan C; Wilhelm S Absolute Quantification of Nanoparticle Interactions with Individual Human B. Cells by Single Cell Mass Spectrometry. Nano Lett. 2022, 22 (10), 4192–4199. 10.1021/acs.nanolett.2c01037. [DOI] [PMC free article] [PubMed] [Google Scholar]
- (56).Donahue ND; Kanapilly S; Stephan C; Marlin MC; Francek ER; Haddad M; Guthridge J; Wilhelm S Quantifying Chemical Composition and Reaction Kinetics of Individual Colloidally Dispersed Nanoparticles. Nano Lett. 2022, 22 (1), 294–301. 10.1021/acs.nanolett.1c03752. [DOI] [PubMed] [Google Scholar]
- (57).Stephan T; Roesch A; Riedel D; Jakobs S Live-Cell STED Nanoscopy of Mitochondrial Cristae. Sci. Rep. 2019, 9 (1), 1–6. 10.1038/s41598-019-48838-2. [DOI] [PMC free article] [PubMed] [Google Scholar]
- (58).Huff J The Airyscan Detector from ZEISS: Confocal Imaging with Improved Signal-to-Noise Ratio and Super-Resolution. Nat. Methods 2015, 12 (12), ii. 10.1038/NMETH.F.388. [DOI] [Google Scholar]
- (59).Wang Z; Tiruppathi C; Minshall RD; Malik AB Size and Dynamics of Caveolae Studied Using Nanoparticles in Living Endothelial Cells. ACS Nano 2009, 3 (12), 4110–4116. 10.1021/nn9012274. [DOI] [PMC free article] [PubMed] [Google Scholar]
- (60).Bolaños K; Kogan MJ; Araya E Capping Gold Nanoparticles with Albumin to Improve Their Biomedical Properties. Int. J. Nanomedicine 2019, 14, 6387–6406. 10.2147/IJN.S210992. [DOI] [PMC free article] [PubMed] [Google Scholar]
- (61).Bukackova M; Rusnok P; Marsalek R Mathematical Methods in the Calculation of the Zeta Potential of BSA. J. Solution Chem. 2018, 47 (12), 1942–1952. 10.1007/s10953-018-0830-0. [DOI] [Google Scholar]
- (62).Connor EE; Mwamuka J; Gole A; Murphy CJ; Wyatt MD Gold Nanoparticles Are Taken up by Human Cells but Do Not Cause Acute Cytotoxicity. Small 2005, 1 (3), 325–327. 10.1002/smll.200400093. [DOI] [PubMed] [Google Scholar]
- (63).Reifarth M; Hoeppener S; Schubert US Uptake and Intracellular Fate of Engineered Nanoparticles in Mammalian Cells: Capabilities and Limitations of Transmission Electron Microscopy-Polymer-Based Nanoparticles. Adv. Mater. 2018, 30 (9), 1703704. 10.1002/adma.201703704. [DOI] [PubMed] [Google Scholar]
- (64).Dai Q; Wilhelm S; Ding D; Syed AM; Sindhwani S; Zhang Y; Chen YY; Macmillan P; Chan WCW. Quantifying the Ligand-Coated Nanoparticle Delivery to Cancer Cells in Solid Tumors. ACS Nano 2018, 12 (8), 8423–8435. 10.1021/acsnano.8b03900. [DOI] [PubMed] [Google Scholar]
- (65).Denisin AK; Pruitt BL Tuning the Range of Polyacrylamide Gel Stiffness for Mechanobiology Applications. ACS Appl. Mater. Interfaces 2016, 8 (34), 21893–21902. 10.1021/acsami.5b09344. [DOI] [PubMed] [Google Scholar]
- (66).Papadopulos F; Spinelli M; Valente S; Foroni L; Orrico C; Alviano F; Pasquinelli G Common Tasks in Microscopic and Ultrastructural Image Analysis Using ImageJ. Ultrastruct. Pathol. 2007, 31 (6), 401–407. 10.1080/01913120701719189. [DOI] [PubMed] [Google Scholar]
- (67).Kannan KS; Manoj K; Arumugam S Labeling Methods for Identifying Outliers. Int. J. Stat. Syst. 2015, No. October. [Google Scholar]
- (68).Otsu N A Threshold Selection Method from Gray-Level Histograms. IEEE Trans. Syst. Man. Cybern. 1979, 9 (1), 62–66. 10.1109/TSMC.1979.4310076. [DOI] [Google Scholar]
Associated Data
This section collects any data citations, data availability statements, or supplementary materials included in this article.
Supplementary Materials
Data Availability Statement
The data and code used from this study will be posted to FigShare.