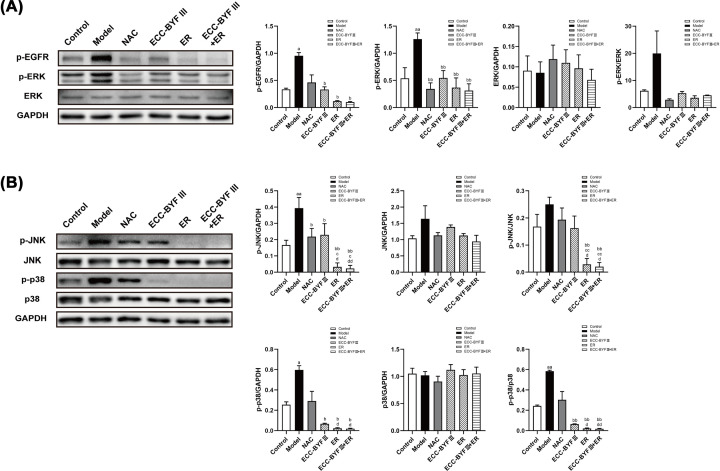
Figure 7. Protein expression of EGFR, ERK, JNK, and p38 in the airway of COPD rats.
The protein expression of p-EGFR, p-ERK, ERK, p-JNK, JNK, p-p38, and p38. Values are the mean ± SE, (n=3). aP<0.05 vs. the normal control group; aaP<0.01 vs. the normal control group; bP<0.05 vs. the disease model group; bbP<0.01 vs. the disease model group; cP<0.05 vs. the NAC group; ccP<0.01 vs. the NAC group; dP<0.05 vs. the ECC-BYF III group; ddP<0.01 vs. the ECC-BYF III group.

