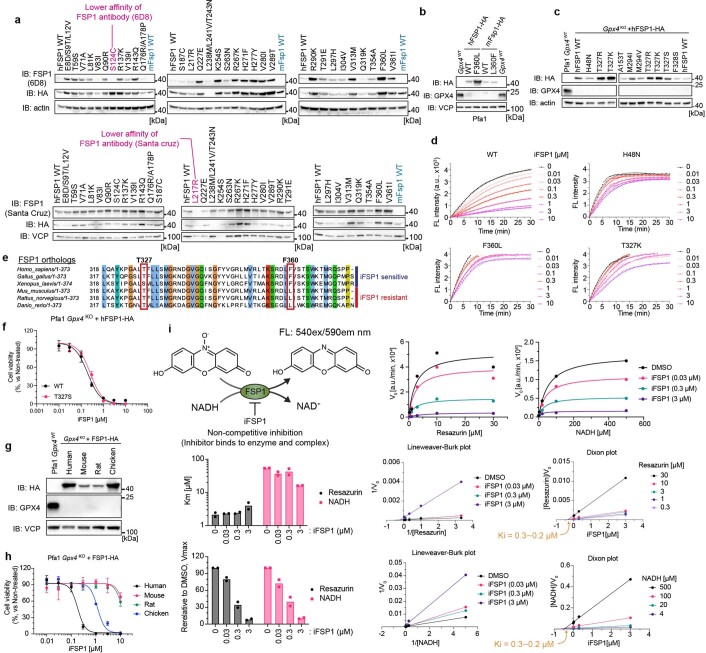
Extended Data Fig. 4. Identification of the iFSP1 binding pocket via site-directed mutagenesis.
a. Immunoblot analysis of FSP1 (clone 6D8, AMID: Santa Cruz, and HA), actin, and VCP expression in Pfa1 cells stably overexpressing wildtype hFSP1 or its mutant variants. Each human specific FSP1 antibody (6D8 and Santa Cruz) showed a lower affinity against the highlighted human FSP1 mutants similar to mouse wildtype FSP1. b. Immunoblot analysis of GPX4, FSP1 (HA), and VCP expression in Pfa1 cells stably overexpressing wildtype hFSP1 and its mutant variants. c. Immunoblot analysis of GPX4, FSP1 (HA), and actin expression in Pfa1 cells stably overexpressing wildtype hFSP1 and its mutant variants. Data is shown from a single experiment (a-c). d. Representative resazurin reduction assay in the presence of wildtype FSP1 or its mutant variants with the indicated concentrations of iFSP1. Data represents a single well of a 96-well plate from one out of 3 independent experiments. e. Alignment of different FSP1 orthologues. Note, T327 and F360 (in human position) are different among species. f. Cell viability of Pfa1 Gpx4-KO cells stably expressing wildtype hFSP1 or the T327 mutant treated with iFSP1 for 24 h. Data represents the mean ± SD of 3 wells of a 96-well plate from one out of 2 independent experiments. g. Immunoblot analysis of GPX4, FSP1 (HA), and VCP expression in Pfa1 cells stably overexpressing wildtype FSP1 orthologues from a single experiment. h. Cell viability of Pfa1 Gpx4-KO cells stably expressing the different wildtype FSP1 orthologues treated with iFSP1 for 24 h. Data represents the mean ± SD of 3 wells of a 96-well plate from one out of 3 independent experiments. i. Enzyme kinetics in vitro assay. Schematic representation of the FSP1 enzyme activity assay using resazurin and NADH as the substrates. Representative reduction kinetics of resazurin, bar plots of the Km and relative Vmax values, Lineweaver-Burk plot, and Dixon plot in the presence of different concentrations of either NADH or resazurin with iFSP1 at indicated concentrations. Reduction kinetics, Lineweaver-Burk plot, and Dixon plot represent a single well of a 96-well plate from one out of 2 independent experiments. Bar plots represent the mean from 2 independent experiments.

