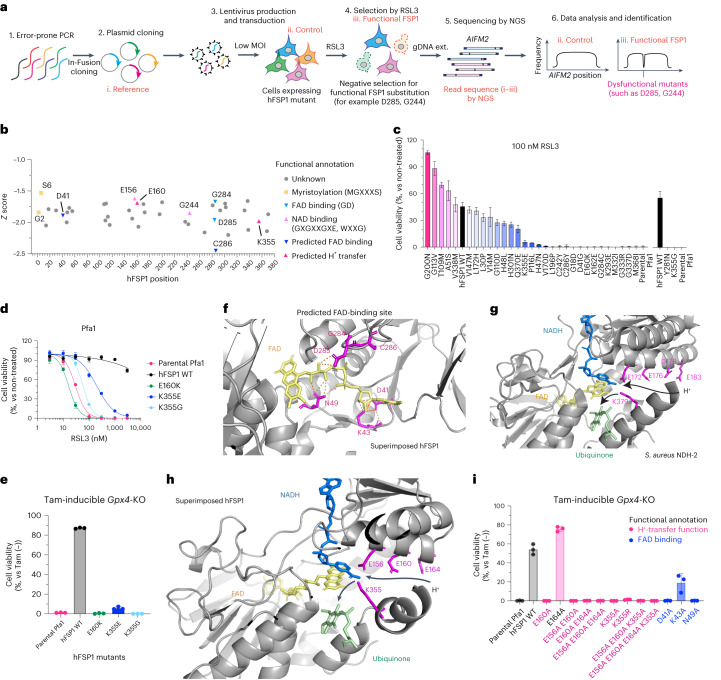
Fig. 2. An unbiased genetic screen uncovers the proton-transfer function of FSP1.
a, Schematic of the mutational screen. AIFM2 was mutated using error-prone PCR (Step 1). PCR fragments were then cloned into plasmids (i. Reference) using the seamless cloning enzyme "in-Fusion" (Step 2). Lentivirus pools using randomly mutated plasmids were transduced into Pfa1 cells (ii. Control) with low multiplicity of infection (MOI) (Step 3). Cells overexpressing mutated FSP1 were selected by RSL3 (iii. Functional FSP1) (Step 4). Surviving clones were harvested and genomic DNA was extracted and followed by NGS sequencing (Step 5). Sequencing results were analyzed and mutations were identified (Step 6). gDNA ext., genomic DNA extraction. b, Representative summary of dysfunctional FSP1 substitutions after Z-score calculation. Mutated residues in the myristoylation motif (MGXXXS, yellow), NADH-binding motif (GXGXXGXE, WXXG, light pink) or FAD-binding motif (GD, light blue), and those predicted to affect proton-transfer function (E160 and K355, pink) or FAD binding (D41 and C286, blue), are shown. c, Viability of Pfa1 cells stably overexpressing hFSP1-HA or mutant FSP1 that were treated with 100 nM RSL3 for 24 h or that were not treated. Data are shown as the mean ± s.d. of 3 wells of a 384-well plate (left) or a 96-well plate (right) from one experiment. d, Viability of Pfa1 cells stably overexpressing WT hFSP1-HA or mutant FSP1 that were treated with RSL3 for 24 h or that were not treated. e, Viability of Pfa1 cells stably overexpressing WT hFSP1 or a mutant that were treated with 1 µM Tam for 72 h or that were not treated. Data were normalized to each group that was not treated with Tam (Tam (–)). Data are shown as the mean ± s.d. of 3 wells of a 96-well plate from 1 of 3 independent experiments (d,e). f, Superimposed hFSP1 structure with FAD (yellow) and FAD-binding residues. FAD was embedded from the structure of S. aureus NDH-2 (PDB: 5NA1), and expected hydrogen bonds were generated using Pymol. g, Superimposed S. aureus NDH-2 structure (PDB: 5NA1) with the co-factors FAD (yellow), NADH (blue) and CoQ5 (green). The proton transfer through sequential carboxylic residues in the α-helix (that is, E172, E176, D179 and E183) and subsequent final protonation from K379 to ubiquinone are indicated with black arrows. h, Proposed FSP1 proton transfer through sequential carboxylic residues in the α-helix (that is, E156, E160 and E164) and subsequent final protonation from K355 to ubiquinone are indicated with black arrows. i. Viability was measured in Pfa1 cells stably overexpressing WT hFSP1 or mutants after treatment with 1 µM Tam for 72 h or without treatment. Data were normalized to each group that was not treated with Tam. Data are shown as the mean ± s.d. of 3 wells of a 96-well plate from 1 of 2 independent experiments.

